windows security | windows events
In the past, we’ve written about monitoring file access in Windows. However, monitoring file access events alone doesn’t capture the full lifecycle of changes that matter for security and compliance.
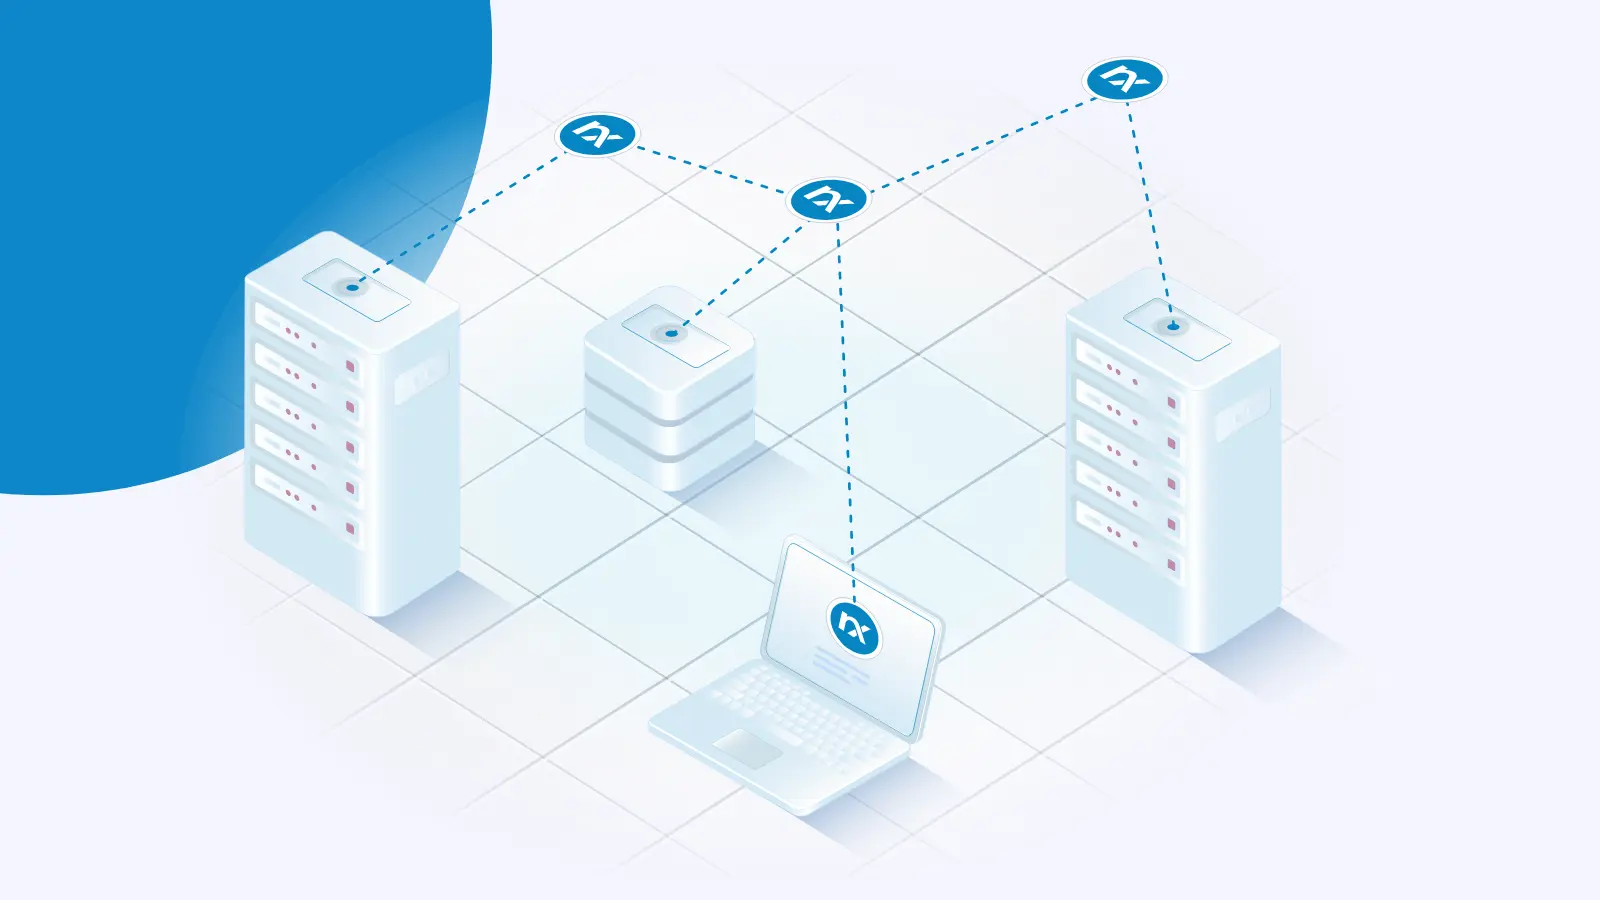
To gain true end-to-end visibility, you need to track not only when a file is accessed, but also when it’s modified, renamed, or deleted. In this guide, we’ll show how combining File Integrity Monitoring (FIM) with Windows Security Auditing delivers a complete file monitoring solution and how NXLog Agent ties these log sources together.
dns monitoring | bind9
Monitoring BIND9 logs: Comparing syslog and dnstap for DNS visibility
As system and network administrators know, DNS logs are essential for understanding what’s happening across your infrastructure, whether you’re troubleshooting slow lookups, investigating odd traffic patterns, or monitoring your security posture.
We recently had the opportunity to help a customer set up monitoring for BIND9 logs and discovered that the two main options, syslog and dnstap, offer very different experiences in setup, performance, and the level of DNS visibility they provide.
linux security | linux logs | elasticsearch
Linux security monitoring: Collecting and visualizing events in Elasticsearch and Kibana
Timely visibility into system activity is what separates effective defense from reactive analysis. Every operating system, application, and device logs a trail of evidence. However, transforming that trail into actionable intelligence requires the right tools. In our previous posts, we’ve walked you through:
Visualizing VPN connection logs,
Monitoring Windows security events, and
Analyzing web server activity logs.
In this final installment in our series on log visualization, we’re turning our attention to Linux security monitoring.
infrastructure monitoring | observability | telemetry management
The shadow IT haunting your network: A Halloween horror story
It’s Halloween season, and while everyone else is worried about ghosts and goblins, you—the sysadmin holding the fort—know the real terror: that dusty print server in the corner that’s been running firmware from 2014. Or the Raspberry Pi someone set up to monitor the server room temperature "temporarily" three years ago. Or the CEO’s personal tablet that absolutely must connect to the internal network because "it’s just easier this way.
infrastructure monitoring | observability | telemetry management
Watching the watchers: The need for telemetry system observability
Organizations invest heavily in sophisticated monitoring platforms, deploy countless agents across their infrastructure, and build elaborate dashboards to track every metric imaginable. Yet amid this pursuit of comprehensive visibility, a dangerous blind spot often emerges: the observability system itself becomes unobservable.
This meta-problem represents one of the most insidious risks in modern infrastructure management. When telemetry collection fails silently—whether due to misconfiguration, infrastructure changes, or system failures—operations teams continue making critical decisions based on incomplete or stale data, unaware that their digital nervous system has developed gaps in coverage.
infrastructure monitoring | observability | telemetry management
Beyond the silicon: Why AI infrastructure monitoring is critical to ROI
The AI gold rush has arrived, and organizations worldwide are making unprecedented investments in cutting-edge accelerator hardware. GPU clusters worth millions of dollars are being deployed at breakneck speed, with companies betting their competitive futures on these silicon powerhouses. Yet beneath the excitement of acquiring the latest H100s or MI300s lies a sobering reality: the most expensive part of your AI investment isn’t the initial purchase—it’s ensuring that hardware delivers value every single moment it’s operational.


