
An excellent way to get started in a new technology area or refresh our knowledge is to devise a solution based on a small idea or need. This blog post covers such a situation, with a small personal project demonstrating how to use NXLog’s powerful features.
I embarked on a small pet project centered around a cloud machine running Debian 10. It connects telemetry from my home, country house, and notebook.
Like with any other of my hobby projects, I faced some challenges I needed to solve:
-
With some ports exposed to the open Internet, this setup constantly encountered the issue of unauthorized access attempts.
-
Since I cannot constantly monitor text logs, I needed to build a simple monitoring system to check if anyone (other than me) accesses the setup.
I was thinking of a solution where I could hit two birds with a stone, solving both of the problems.
In this post, I will not only tell you but also walk you through how to set up this project. Even though it is just a pet project for me, the scenario of solving an unauthorized access problem could be the same on any other network. Hopefully, this will inspire you to try something similar.
Architecture
Your first step in such a project should always be to understand the architecture, the software tools, and the information structures those tools need.
In this case, you will move data from Uncomplicated Firewall (UFW) to a Grafana Loki deployment. UFW is an embedded firewall for standard Debian and Ubuntu distributions that detects network connection attempts. Loki is a metric-collecting and alerting software dedicated to collecting and storing log strings. Finally, Grafana is a visualization dashboard that supports working with many different data sources (so you can use it for multiple log sources).
The project aims to collect and parse log data from UFW, send that data to Loki, and set up data visualization in Grafana to analyze the streamlined logs efficiently and conveniently.
Understanding UFW logs
The starting point is becoming familiar with the UFW log entries.
UFW keeps its logs in a standard location: /var/log/ufw.log.
The log type is plain text with ASCII symbols, covering one event per line as shown in the following example.
Sep 24 11:55:42 332812-cl91404 kernel: [58638723.689338] [UFW AUDIT] IN=eth0 OUT= MAC=xx:xx:xx:xx:xx:xx SRC=164.92.131.91 DST=xxx.xxx.xxx.xxx LEN=40 TOS=0x00 PREC=0x00 TTL=242 ID=54321 PROTO=TCP SPT=56243 DPT=31191 WINDOW=65535 RES=0x00 SYN URGP=0
Sep 24 11:55:42 332812-cl91404 kernel: [58638723.689363] [UFW BLOCK] IN=eth0 OUT= MAC=xx:xx:xx:xx:xx:xx SRC=164.92.131.91 DST=xxx.xxx.xxx.xxx LEN=40 TOS=0x00 PREC=0x00 TTL=242 ID=54321 PROTO=TCP SPT=56243 DPT=31191 WINDOW=65535 RES=0x00 SYN URGP=0
As you can see, every log entry is a string consisting of three distinct parts:
-
Space-delimited header with timestamp, hostname, and event marker (syslog BSD style).
-
A middle section in square brackets with the onboard timer and event name.
-
Key-value pair (KVP) tail with event properties.
The information in these log entries must be parsed and restructured to the intended input for their destination (Loki).
Understanding the Loki input
Loki has a very unique approach, in that it does not parse and/or index the log strings ingested. Instead, Loki relies on the timestamp and labels previously prepared by other software tools, NXLog in this case. This approach allows Loki to operate very quickly but requires extra care in assembling the data to send so that labels match.
The following example shows the input data structure expected by Loki.
Loki expects data in quite a strict JSON structure. While this example is prettified for readability, messages sent to Loki should be unprettified.
{
    "streams": [
      {
        "stream": {
          "labelname": "labelcontents",
          "labelname": "labelcontents"
        },
        "values": [
          [
            "timestamp-as-nanoseconds-from-unix-epoch",
            "log-string",
            "timestamp-as-nanoseconds-from-unix-epoch",
            "log-string"
          ]
        ]
      }
    ]
}
Loki expects the event timestamp to be the number of nanoseconds since the Unix epoch.
If not handled carefully, this can potentially create an error because integer(now()) returns milliseconds, and the $EventTime value is in microseconds.
So, you must adjust that value before sending the data to Loki.
|
Selecting the information
Now that you know the information you have (the log input) and how Loki wants to receive the information, it’s time to decide what to send.
This is important so you know what to parse but also to decide how to label that information, since those labels will be used later to set up the visualization.
For this example, you will send Loki the following information:
-
Hostname, with the
hostlabel, to identify where the log entry came from. -
Name of the software that generated the log entry (always "ufw" in this example), with the
softlabel. -
IP for the source of the connection attempt, with the
srclabel. -
IP for the destination of the connection attempt, with the
dstlabel. -
Timestamp of the event and the full log entry, in case it’s needed later on for auditing extra information, with the
valueslabel.
This will cover using NXLog to extract and process information from all three parts of a log entry. Once you know the NXLog configuration steps it will be easy to adapt, if later on you want to send a different set of information to Loki.
Converting the information
All three parts (header, square brackets, and tail) of the log entry need to be parsed. Each conversion requires slightly different strategies, as the information is stored in different structures. Before we start, we must make sure we have the right tools for each conversion.
The space-delimited header is in a syslog BSD style, that NXLog efficiently processes through parse_syslog_bsd(). The content in square brackets is easy to extract through a regular expression. The tail of the log entry is a series of key-value pairs (KVP) with event properties, that NXLog handles through the parse_kvp() procedure.
Once you collect all the required information, you need to convert it to the JSON structure Loki is expecting to receive. You can create that information structure with xm_rewrite.
This example starts by parsing the log entry to access the required information.
From the header, we want to retrieve the host and timestamp fields.
From the brackets, we want to retrieve the event name.
The rest of the log entry has the src and dst fields that we also need.
Then, through xm_rewrite, the relevant information is converted to the information structure required by Loki.
Since this process involves multiple parsing steps and conversion to a new structure and format, it’s prudent to insert a temporary validation point. To handle this, you’ll see how to use a temporary output file to validate if the parsing and conversion are correctly done.
<Extension kvp>
    Module              xm_kvp
    KVPDelimiter        " "
    KVDelimiter         =
    EscapeChar          \\
</Extension>

<Extension json>
    Module              xm_json
    PrettyPrint         FALSE
    Flatten             FALSE
    UnFlatten           TRUE
    DetectNestedJSON    TRUE
</Extension>

<Extension syslog>
    Module              xm_syslog
</Extension>

<Extension rw_to_loki>
    Module              xm_rewrite
    <Exec>
        $$values = [[ string(integer($EventTime)*1000), $Message ]]; (1)
        $streams = [ ("stream"=>("host"=>$Hostname, "soft"=>"ufw", "evt"=>$Event, "src"=>$SRC, "dst"=>$DST), "values"=>$$values) ]; (2)
    </Exec>
    Keep                streams (3)
</Extension>

<Input in_file>
    Module              im_file
    File                "/var/log/ufw.log"
    <Exec>
        parse_syslog_bsd(); (4)
        if $Message =~ /\[(.*?)\] \[(.*?)\]/ (5)
        {
            $Event= $2;
        }
        kvp->parse_kvp($Message); (6)
    </Exec>
</Input>

<Output out_file> (7)
    Module              om_file
    File                "/opt/nxlog/var/log/nxlog/outfile.json"
    Truncate            TRUE
    <Exec>
        rw_to_loki->process();
        to_json();
    </Exec>
</Output>

<Route route_test>
    Path                in_file => out_file
</Route>| 1 | Adapts the event timestamp to what Loki expects. |
| 2 | Restructure the parsed values into the log entry to be delivered to Loki with the intended labels. |
| 3 | Keeps only the information assembled for Loki. |
| 4 | Parses the header with the parse_syslog_bsd() procedure in NXLog’s xm_syslog extension module.
The procedure returns the host in the $Hostname field, the timestamp in the $EventTime field, and the unparsed message tail in the $Message field. |
| 5 | Extracts the information in the square brackets in the $Message field with the built-in regular expression.
This command moves the content from the brackets into the $1 and $2 fields. |
| 6 | Parses the rest of the $Message field (a series of key-value pairs), using the parse_kvp() procedure, which parses all $Message key-value pairs and copies them into appropriately named fields. |
| 7 | This route is temporary. Once the testing is complete, it will be replaced by the route to Loki. |
You should now have something similar to the following example.
{"streams":[{"stream":{"host":"332812-cl91404","soft":"ufw","evt":"UFW BLOCK","src":"159.203.224.38","dst":"xxx.xxx.xxx.xxx"},"values":[["1695499218000000000","[58595799.836079] [UFW BLOCK] IN=eth0 OUT= MAC=xx:xx:xx:xx:xx:xx SRC=159.203.224.38 DST=xxx.xxx.xxx.xxx LEN=40 TOS=0x00 PREC=0x00 TTL=242 ID=54321 PROTO=TCP SPT=42879 DPT=6379 WINDOW=65535 RES=0x00 SYN URGP=0 "]]}]}The log data is now fully parsed and assembled according to Loki’s requirements. Your next step is sending that data to Loki.
Sending data to Loki
Promtail is the primary agent for sending data to Loki but might not always be the best choice, especially in heavily heterogeneous environments where flexibility is necessary. In this example, you’ll use the built-in HTTP module of NXLog Agent, which interacts directly with Loki’s JSON-capable endpoint, as described in the Grafana Loki documentation.
Loki does not include any built-in connection protection, and it is typically deployed alongside a reverse proxy for extended security. Grafana Cloud, however, secures HTTPS connections and enables Basic Authorization. When you register for Grafana Cloud you are provided with login details and you can generate an API key through their online platform to facilitate secure data interactions.
To connect to Loki, use NXLog’s om_http module which provides a reliable and safe method of data transmission.
<Output out_loki>
    Module om_http (1)
    URL                      <Your Grafana API URL>
    HTTPBasicAuthUser        <Your Grafana user>
    HTTPBasicAuthPassword    <Your Grafana password>
    ContentType              application/json
    Compression              none
    HTTPSAllowUntrusted      TRUE

    <Exec> (2)
        rw_to_loki->process();
        to_json();
    </Exec>
    <OnError>
        <Exec>
        $$response_code = get_response_code();
        if $$response_code==204 drop(); (3)
        else {
            log_info("ErrorCode " + $$response_code);
            drop();
        }
        </Exec>
    </OnError>
</Output>

<Route route_loki> (4)
    Path                     in_file => out_loki
</Route>| 1 | Configures your Loki connection information: the API URL, user, and password. |
| 2 | Formats the information to the intended JSON output format. |
| 3 | Defines the non-standard HTTP response codes to be dropped.
For example, if data is ingested correctly (is not a readout), Loki answers with HTTP code 204 “No content”.
NXLog doesn’t handle this code as successful by default, so this if condition prevents data from being resent to Loki in this situation. |
| 4 | Connects the input processing to the output (Loki) processing. |
Now that you have seen the separate input/collection side and Loki side configurations, below is the full configuration that includes all parts.
<Extension kvp>
    Module                   xm_kvp
    KVPDelimiter             " "
    KVDelimiter              =
    EscapeChar               \\
</Extension>

<Extension json>
    Module                   xm_json
    PrettyPrint              FALSE
    Flatten                  FALSE
    UnFlatten                TRUE
    DetectNestedJSON         TRUE
</Extension>

<Extension syslog>
    Module                   xm_syslog
</Extension>

<Extension rw_to_loki>
    Module                   xm_rewrite
    <Exec>
        $$values = [[ string(integer($EventTime)*1000), $Message ]];
        $streams = [ ("stream"=>("host"=>$Hostname, "soft"=>"ufw", "evt"=>$Event, "src"=>$SRC, "dst"=>$DST), "values"=>$$values) ];
    </Exec>
    Keep                     streams
</Extension>

<Input in_file>
    Module                   im_file
    File                     "/var/log/ufw.log"
    <Exec>
        parse_syslog_bsd();
        if $Message =~ /\[(.*?)\] \[(.*?)\]/
        {
            $Event= $2;
        }
        kvp->parse_kvp($Message);
    </Exec>
</Input>

<Route route_loki>
    Path                     in_file => out_loki
</Route>

<Output out_loki>
    Module om_http
    URL                      <Your grafana API URL>
    HTTPBasicAuthUser        <Your Grafana user>
    HTTPBasicAuthPassword    <Your Grafana password>
    ContentType              application/json
    Compression              none
    HTTPSAllowUntrusted      TRUE
    <Exec>
        rw_to_loki->process();
        to_json();
    </Exec>
    <OnError>
        <Exec>
        $$response_code = get_response_code();
        if $$response_code==204 drop();
        else {
            log_info("ErrorCode " + $$response_code);
            drop();
        }
        </Exec>
    </OnError>
</Output>| Notice that the final configuration no longer includes the output to a temporary text file. |
Verifying data arrival
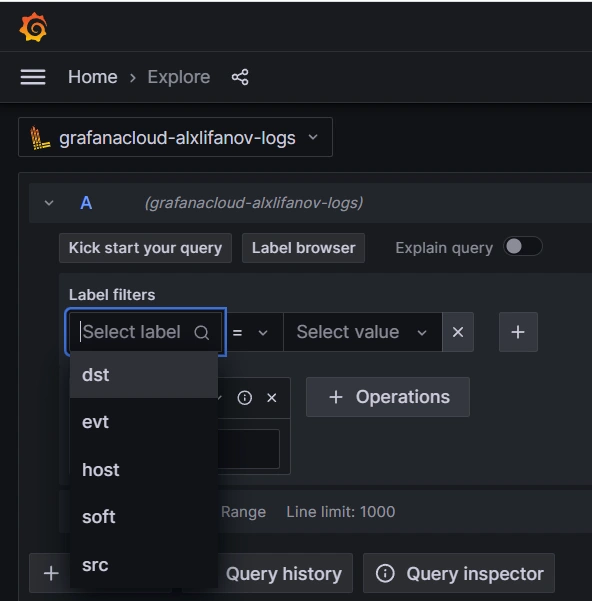
To check if the data has arrived on Loki, use the Explore function in Grafana to select your data source and timeframe.
At this point, you would need to configure the data source in Grafana, but that was already done - for the cloud environment - during the Grafana account registration mentioned above.
You select data sources using the labels defined in the configuration.
Then you need to select a timeframe.
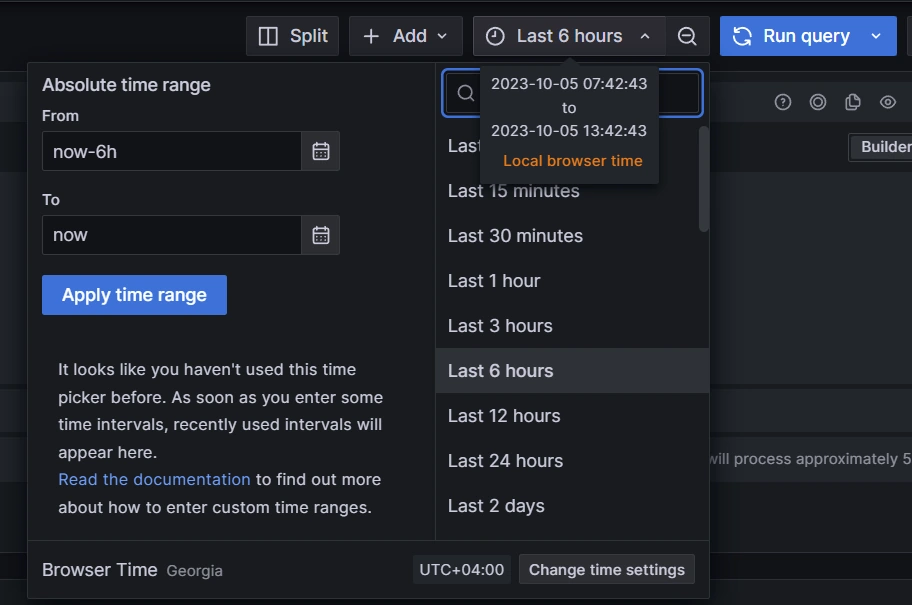
| Remember that data transmission uses the UTC zone, but Grafana uses the local browser time zone. Because of this, you must define the time zones on both ends. Also note that as an error-prevention measure, Loki doesn’t accept data that is either more than 48 hours behind or more than 24 hours ahead of Loki’s time. |
Once these selections are made, you should have something similar to the following example.
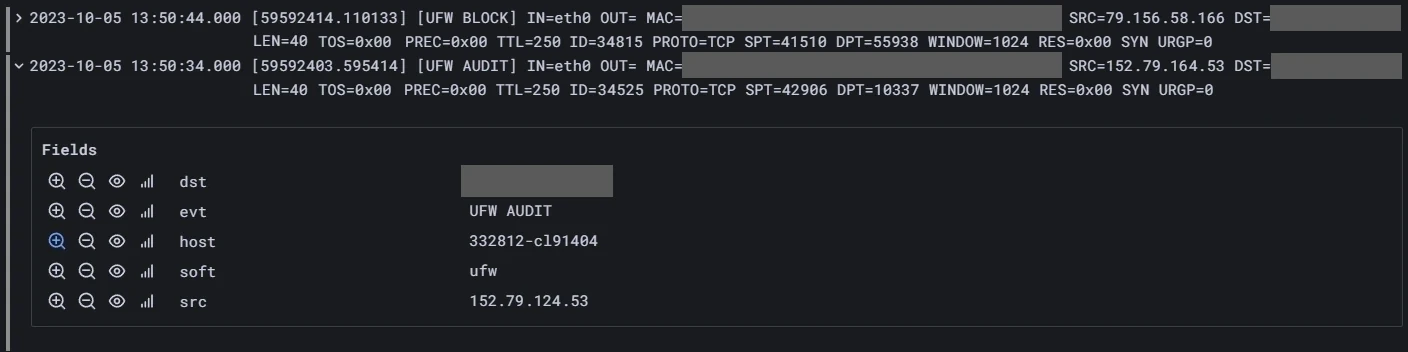
The above validates that your log data is arriving since you can read the log entries on Grafana. While this is useful, you want to get the most out of Grafana’s analysis tools. For that, you want to set up data visualization.
Data visualization
Grafana data visualization is very straightforward. Every dashboard consists of various dynamic graphical elements. Every element fills its space with data extracted by a database request.
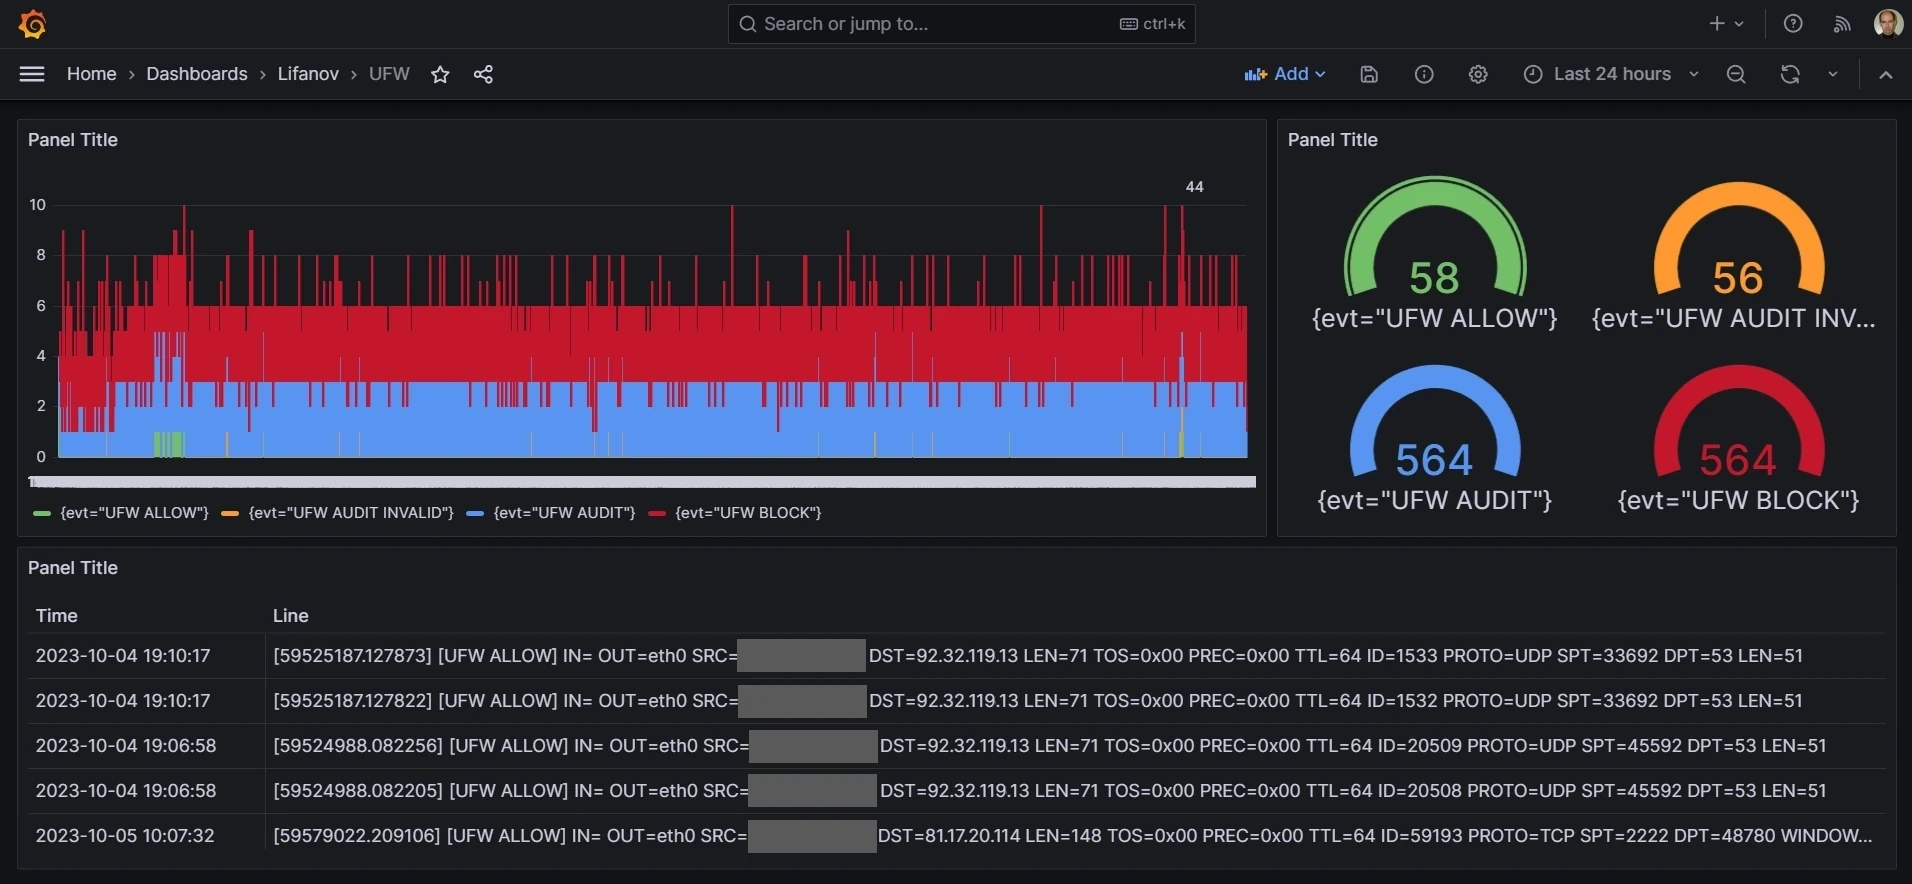
The data can be used in two ways, either "as is" (for table representation) or aggregated (for graphical representation).
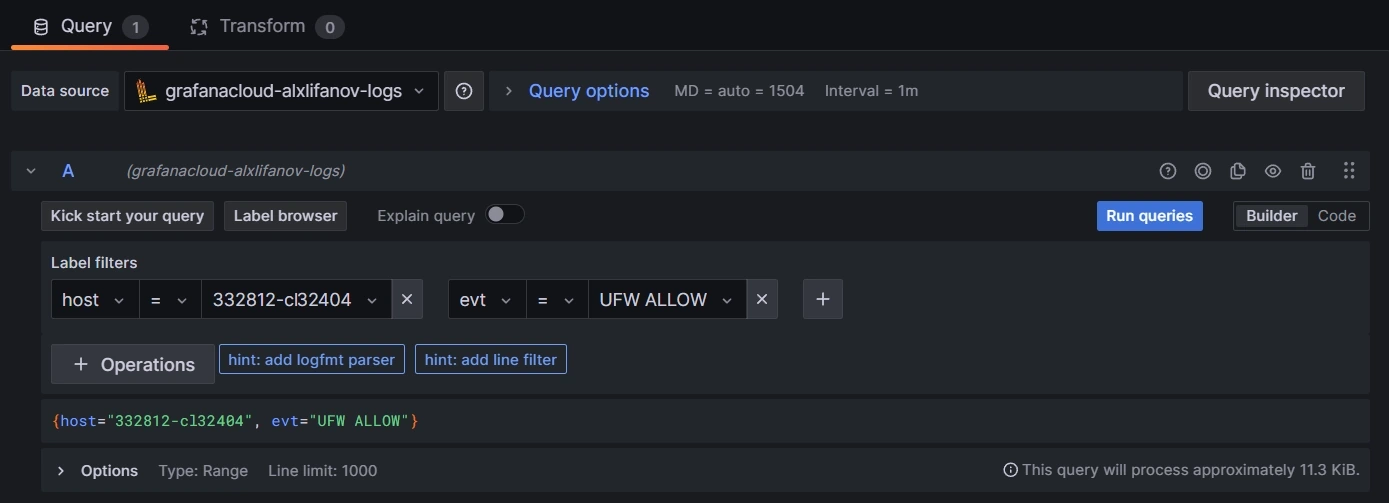
Table representation
To get a table representation, you only need to set label filters.
If needed, you can also filter lines with contains or regex expressions.
Loki adds several service fields which are not relevant to the intended analysis.
Use the Field override function of the Table graphical element to suppress those unnecessary fields.
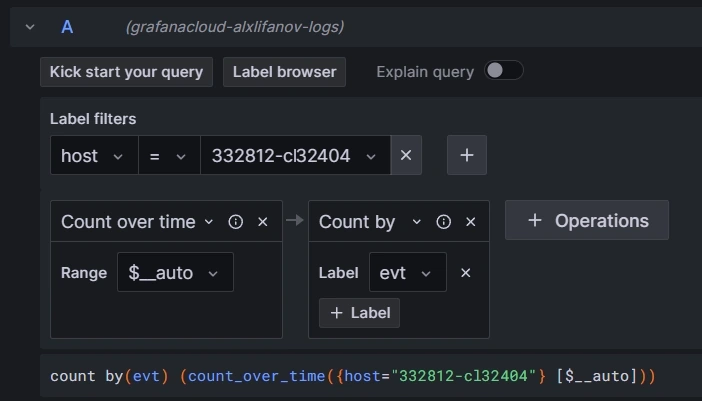
Graphical representation
The graphical representation of Loki data is slightly more complex because text lines can’t be represented directly, since they are not numeric. That conversion is done through aggregation functions. The following example counts the number of specific event types within a dynamic width window (which depends on the overall graph width).
Conclusion
At this point, your project is complete.
This venture has shown how to connect UFW with Loki and Grafana to better monitor network security logs. It is a great example of how NXLog can help with security by simplifying data handling and viewing.
The setup we’ve gone through isn’t just for tackling security issues—it’s also flexible enough to be used in different IT settings. I hope this gives you some good ideas for your projects. If you’re looking for more tips or examples, check out our blog and other resources at NXLog.
I hope this project inspired you to try one of your own. Even if you’re working with different software tools, the project will include similar steps. NXLog provides a powerful and flexible collection tool to connect your systems to a central log analysis tool for whatever project you have in mind.
For another example of a log aggregation and visualization project using NXLog, see our blog post on using Raijin to analyze Windows security events.