Log collection is most closely linked to enterprise security practices—for example, aggregation and analysis in a SIEM. However, collecting certain logs for reasons other than security is often valuable. It may even be a requirement of your organization for the purposes of auditing, legal compliance, or data retention.
Storing all these logs in a database is the most efficient way to manage the data. Finding and managing logs stored as flat files or structured data can be challenging without a database. Even so, not all database engines are suited to ingesting and organizing vast amounts of log data. When choosing a database engine to manage your logs, consider the following "must-have" features:
- Flexible schema
-
This is the number one "must-have" feature. Some log sources, such as those we associate with relational databases, exhibit an inflexible schema. However, suppose you consult Microsoft’s Windows Event Log Reference. In that case, you will soon realize that Microsoft’s XML-based documents to store event data cannot be easily mapped to a relational database schema. For instance, many Windows log sources contain an
EventDatafield: a complex datatype that defines a nested data structure containing multiple subfields. If we examine Windows Sysmon events, theEventDatafield may have as few as three subfields or as many as 17 subfields, depending on the Event ID. Ideally, the database should be able to store such events without data loss and with minimum restructuring. Yes, a relational database could store such events in multiple tables joined by foreign key constraints. Still, a document database or a database engine that supports flexible schemas could do this without defining schemas manually for every log source.Another core feature of analytics-based systems is their ability to aggregate data. Without flexible schemas, a database cannot aggregate logs from disparate log sources that monitor a common category of events. For instance, the only way to aggregate DNS events is to normalize the field/column names and their respective data types common to multiple log sources, such as query name, query type, query class, query severity, process ID, etc. On the other hand, fields/columns not common to multiple log sources, like client ID, query flags, Windows Domain, Provider GUID, etc., can contain valuable data you should not discard. Only a flexible schema can safeguard such log source-specific data.
Even for log sources with fixed schemas, you should consider the probability that their providers will change their schemas over time. Why wouldn’t a log source’s schema undergo updates to keep in step with its parent application? Do you really want to maintain schema changes for every log source you collect?
- High ingestion rate
-
Ideally, log data should be ingested in real-time. Otherwise, consistently accumulating a backlog of events will not result in a sustainable log collection solution. A database infrastructure that cannot ingest all log data of interest in real time will become more of a liability than an asset.
- Time series data optimization
-
One type of log data that is usually important exists as time series data. Unfortunately, most database engines are not equipped to handle this type of data efficiently. The most popular database engines optimized for time series data are MongoDB, Prometheus, and a newcomer, Raijin.
There are many other factors to consider, like total cost of ownership, scalability, ease of configuration, and reliability, to name a few. Still, these three basic requirements are essential and led to the selection of Raijin and Elasticsearch for this comparison. Although Raijin and Elasticsearch are very different in their design and goals, they share some important commonalities.
Introducing Raijin Database
Raijin is a columnar database that supports semi-structured data of varied forms, like logs. The impetus for creating Raijin was the need for a high-performance database engine tailor-made for log data that would also integrate easily and efficiently with NXLog agents. With native JSON support and a built-in REST API, there is no need to install any client-side tools, making it a perfect solution for integrating with web applications. For large organizations already using NXLog, Raijin is the logical choice for managing their logs because it provides the foundation needed for generating real-time analytics.
Under the hood, Raijin has been engineered for high performance. It leverages modern improvements in CPU design—like optimized SIMD instructions (SSE2/AVX2)--to excel when working with vectorized data, which means it can process more data with fewer cycles. In addition, with its hybrid columnar data storage and block-level data compression, you will see a marked reduction in your data storage requirements and better performance with data ingestion and queries. Combined with vectorized execution, it can easily meet the data throughput that analytical workloads demand.
Perhaps the most exciting characteristic of the Raijin database engine is that it achieves its query performance without indexes. Most other database engines would only reach a fraction of their purported performance without explicit, user-defined index definitions.
Database types
Elasticsearch is a document-oriented database, which traditionally falls into the NoSQL category because its flexible schema supports nested data structures, similar to the XML-based documents Windows uses for event logs.
On the other hand, Raijin is in a class all by itself with its flexible schemas, REST API, hybrid columnar data storage, and native SQL capabilities.
It has many similarities with relational database engines.
Because it doesn’t support nested data structures, Raijin stores its rows and columns of data in tables instead of documents.
What sets it apart from the relational crowd is its unique ability to insert data into a newly-created table without first defining a schema, although it does support schema definitions.
The other unique feature is its ability to ingest large batches of JSON data via its REST API, which gives it exceptional write performance.
In addition to the standard INSERT INTO <table> SET syntax, it offers an alternative JSON syntax for inserting JSON-formatted data.
INSERT INTO events {
    "hostname":  "srv-04",
    "eventtime": "2015-06-24 12:20:12Z",
    "eventtype": "ERROR",
    "message":   "Database timeout!"
};
Query languages
Raijin natively speaks SQL. Like other popular NoSQL databases, native Elasticsearch queries follow JSON syntax. Still, the structure and reserved names used for the keys are vendor-specific, as shown in this unaltered example taken directly from Elastic’s documentation on Query and filter context:
Below is an example of query clauses used in query and filter context in the search API. This query will match documents where all of the following conditions are met:
-
The
titlefield contains the word search. -
The
contentfield contains the word elasticsearch. -
The
statusfield contains the exact word published. -
The
publish_datefield contains a date from 1 Jan 2015 onwards.
GET /_search
{
  "query": { (1)
    "bool": { (2)
      "must": [
        { "match": { "title":   "Search"        }},
        { "match": { "content": "Elasticsearch" }}
      ],
      "filter": [ (3)
        { "term":  { "status": "published" }},
        { "range": { "publish_date": { "gte": "2015-01-01" }}}
      ]
    }
  }
}| 1 | The query parameter indicates query context. |
| 2 | The bool and two match clauses are used in the query context, which means that they are used to score how well each document matches. |
| 3 | The filter parameter indicates filter context.
Its term and range clauses are used in the filter context.
They will filter out documents that do not match but will not affect the score for matching documents. |
Although Query DSL (Domain Specific Language) may be the best way to query for documents in Elasticsearch, Elastic is fully aware of the significant, long-term investments most larger organizations have made in SQL-based solutions. For this reason, they offer Elasticsearch SQL as a way to bridge this gap.
If a Raijin database contained the same documents used in the Elasticsearch example above, the equivalent SQL query shown here would work with Raijin right out of the box:
SELECT * FROM tbl
WHERE MATCH (title) AGAINST ('Search')
AND   MATCH (content) AGAINST ('Elasticsearch')
AND   status = 'published'
AND   DATE(publish_date) >= '2015-01-01';
Database performance
We conducted the following benchmarks to see how Raijin stacks up against Elasticsearch:
The CPU used in our tests that produced these benchmarks was an AMD Ryzen 7 4800H. We used the same set of 120,000 logs for benchmarking data ingestion and query processing speed.
Data ingestion speed
The Ingestion tests were performed using variable batch sizes (1-10-100-1000-10000) and client concurrency (1-2-3-4-5-6-7-8).
The test clients sent a fixed amount of data, recording the start and end time, then using the difference to calculate the resulting ingestion speed: number_of_records/elapsed_time.
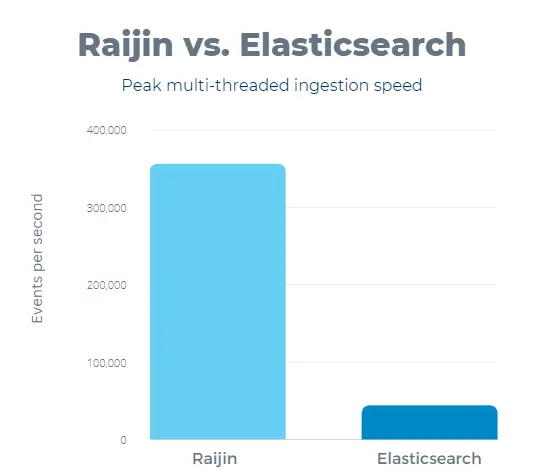
The table below shows the maximum ingestion speed for Raijin and Elasticsearch. Using six threads, Raijin reached its maximum performance of 355,603 events per second, and Elasticsearch reached 43,282 events per second, representing a peak ingestion speed increase of 721% for Raijin.
| Peak | Processes | Batch size | |
|---|---|---|---|
Raijin |
355603 (EPS) |
6 |
10000 |
Elastic |
43282 (EPS) |
8 |
10000 |
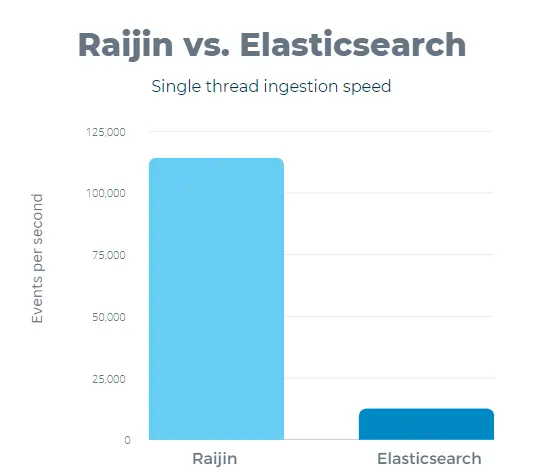
Raijin’s single-thread performance proved to be more than sufficient. In the single-thread test case scenario, ingesting 100,000 records with a batch size of 10,000 events per HTTP request, Elasticsearch consumed 12,419 events per second. In contrast, Raijin ingested 114,058 events per second, showing a performance increase of 818% against Elasticsearch.
The effect of batch size
Elastisearch and Raijin support bundling multiple events or log entries in the same POST request; therefore, we examined the effect of request sizes on the throughput.
The batch size is a configurable setting (BatchSize) in NXLog Enterprise Edition, so it’s essential to understand its effect on performance.
The measurements below were recorded with a single client with varying batch sizes.
| Batch size | Raijin | Elasticsearch |
|---|---|---|
1 |
494.15 EPS |
170.68 EPS |
10 |
4,563.75 EPS |
1,458.41 EPS |
100 |
31,244.90 EPS |
6,879.46 EPS |
1000 |
86,352.00 EPS |
11,647.64 EPS |
10000 |
114,058.59 EPS |
12,419.30 EPS |
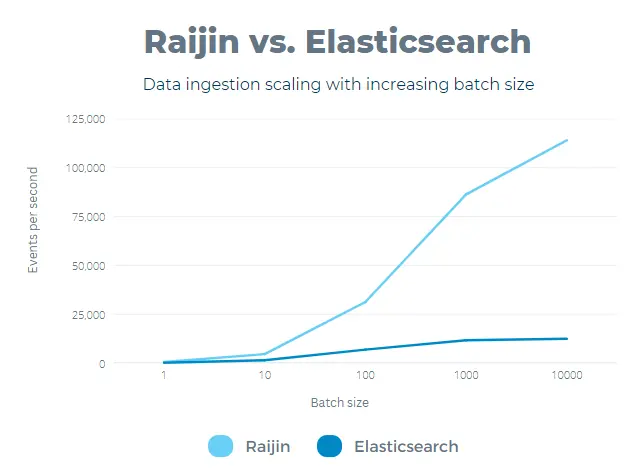
The results show that both Elasticsearch and Raijin favor larger batch sizes, but the improvement is much more pronounced with Raijin.
The effect of client concurrency
We also took a look at how these databases scale with multiple clients. This is an important factor when designing a data delivery pipeline - the number of clients directly feeding into the database may need to be limited to maximize performance.
The measurements below were recorded with a fixed 10,000 event batch size.
| Client count | Raijin | Elasticsearch |
|---|---|---|
1 |
114,058.59 EPS |
12,419.30 EPS |
2 |
200,347.17 EPS |
17,593.05 EPS |
3 |
282,055.50 EPS |
24,077.87 EPS |
4 |
285,867.42 EPS |
27,939.35 EPS |
5 |
323,411.97 EPS |
32,387.89 EPS |
6 |
355,603.18 EPS |
35,713.75 EPS |
7 |
330,671.73 EPS |
41,631.91 EPS |
8 |
282,681.83 EPS |
41,571.82 EPS |
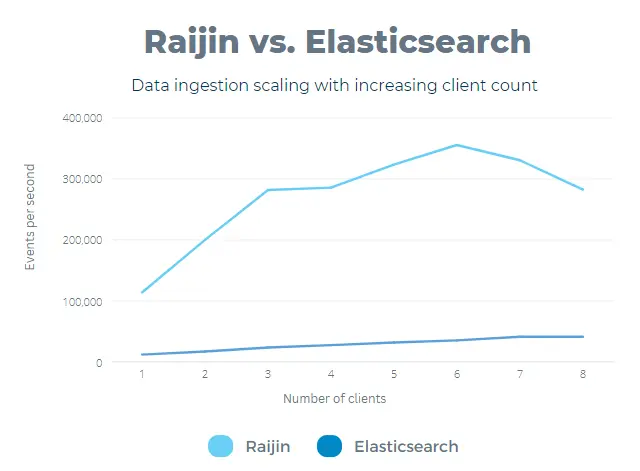
Elasticsearch levels out after seven clients without a performance drop. Raijin peaks at six clients, with a marked decline in ingestion performance with higher concurrency. This result suggests that the number of clients feeding the database on the given system should not be higher than 6 for Raijin. Elasticsearch shows no performance drop with eight clients, and we did not notice a performance drop in the range of the tests.
Query processing speed
We executed 21 different queries against the database explicitly created for the tests, containing approximately 175 million records. Each query was run cold after a database restart.
query1: SELECT AVG(case when c3 < 0 then c3 end) FROM logs GROUP BY uid
query2: SELECT AVG(c3) FROM logs GROUP BY uid
query3: SELECT COUNT(c3) FROM logs GROUP BY uid
query4: SELECT MAX(c3) FROM logs GROUP BY uid
query5: SELECT MIN(c3) FROM logs GROUP BY uid
query6: SELECT SUM(c3) FROM logs GROUP BY uid
query7: SELECT COUNT(c3) FROM logs WHERE uid = 24 GROUP BY uid
query8: SELECT COUNT(DISTINCT c3) FROM logs WHERE uid = 24 GROUP BY uid
query9: SELECT COUNT(*) FROM logs WHERE ip LIKE '32%.%.%.127'
query10: SELECT COUNT(c3) FROM logs WHERE c3 < 0
query11: SELECT COUNT(case when c3 < 0 then c3 end) FROM logs
query12: SELECT COUNT(CAST(c3 AS INT)) FROM logs WHERE c3 > -200
query13: SELECT COUNT(CAST(c3 AS FLOAT)) FROM logs WHERE c3 > -200
query14: SELECT COUNT(CAST(c3 AS DOUBLE)) FROM logs WHERE c3 > -200
query15: SELECT COUNT(CAST(c3 AS STRING)) FROM logs WHERE c3 > -200
query16: SELECT COUNT(c3) FROM logs WHERE MOD(c3,2) <> 0
query17: SELECT COUNT(c3) FROM logs WHERE MOD(c3,2) = 0
query18: SELECT FIRST(c3) FROM logs GROUP BY uid
query19: SELECT LAST(c3) FROM logs GROUP BY uid
query20: SELECT COUNT(IIF(success=false,True,null)) FROM logs where '2022-06-02'<time and time<'2022-06-02'
query21: SELECT COUNT(action) FROM logs where '2022-06-01'<time and time<'2020-06-30' and success=false
The measurements recorded database response times, so lower numbers are better.
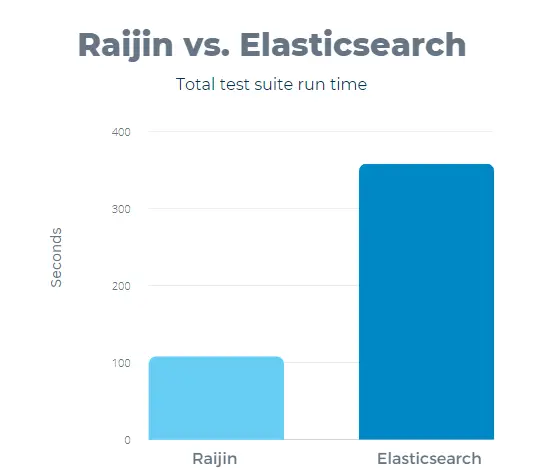
Clearly, Raijin maintains a considerable lead for the total run time, but some of the queries favor Elasticsearch.
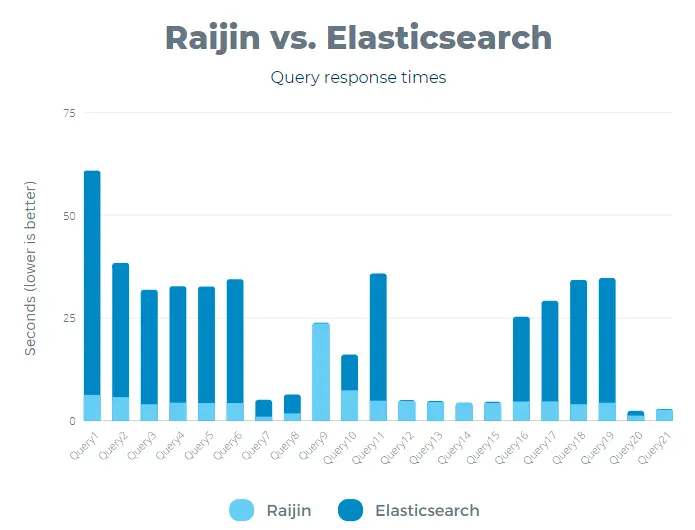
To summarize these results, it is readily apparent that Raijin is a better choice for aggregation queries in general.
Elasticsearch performed poorly in 11 of these 21 queries, taking over 20 seconds to return results.
When executing six of these queries, Elasticsearch needed more than half a minute to return any results.
The poorest performance was the roughly 55 seconds Elasticsearch needed to complete query0.
However, even when Elasticsearch was faster than Raijin while running query11 through query14 (probably due to the CAST function within COUNT()), Raijin’s poorer performance was still in the sub-5-second range, a far cry from taking more than half a minute to return results!
The biggest surprise was Elasticsearch performing better than Raijin on query20, which counts how many documents contain the action field and uses the time field to filter the results to a specific date range.
However, the query only took under three seconds with Raijin, which is still a perfectly reasonable length of time.
Average CPU usage
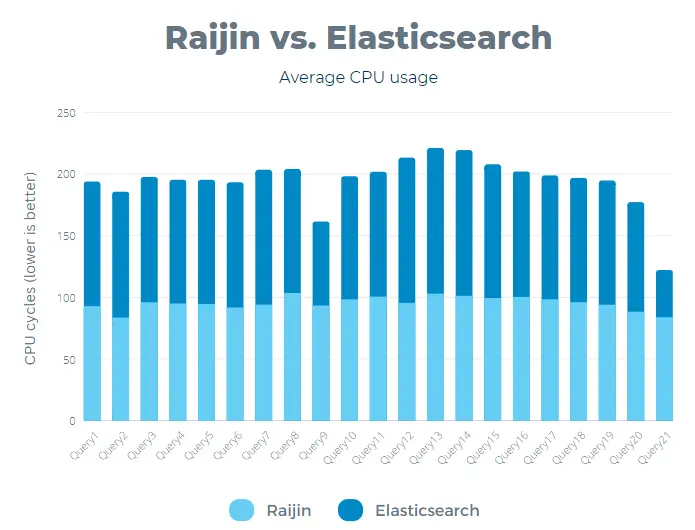
Elasticsearch CPU usage increased with the number of CPU threads, reaching a maximum value of 637 cycles. On the other hand, Raijin reached a maximum of 485 cycles, which translates to a 31% lower average CPU usage than Elasticsearch.
On a side note, while benchmarking the query speeds, Raijin demonstrated lower CPU usage in 17 out of 21 tests, while Elasticsearch had high CPU usage in most tests.
Who is the winner?
Actually, both are winners. They both offer schemaless (schema flexibility) storage of log records, which is essential for maintaining the integrity of event logs. In addition, they both perform well when querying date/time ranges of time-series data.
However, each database engine has its area of expertise, which became evident during our performance testing.
For example, if data ingestion rates are a problem in your enterprise, Raijin is the better choice for collecting and managing your logs.
Also, Raijin’s performance with actual aggregation queries that involve a GROUP BY clause is phenomenal.
So, if real-time data analytics is your goal, you will be better served using Raijin for that task.
Elasticsearch still reigns as the king of full-text search in the world of database engines. If full-text search performance is your most important feature, then you are probably already using Elasticsearch and should stick with it if that is your highest priority. For most use cases, Raijin’s full-text search performance is acceptable. However, the need to perform full-text searches will be significantly diminished when paired with NXLog’s powerful parsing capabilities. This is especially true once NXLog has parsed catch-all fields used for storing embedded but flattened, structured data and has sent these new fields to Raijin as dedicated columns in a flexible schema. Ideally, most log data should be parsed as structured data. The need for excessive full-text searches is often an indicator of a data model that could use some design improvements.
If you are unaware of this, Raijin offers a perk that you might find very appealing. Raijin can be downloaded for free and used as an on-premises database engine, meaning you are free to deploy it anywhere you like, and you can manage your logs without any subscription or data storage costs.
Solutions for common needs
- Log storage and analytics
-
Most NoSQL solutions are inefficient or lack support for analytical queries. Raijin Database is optimized for high-volume log ingestion and exhibits exceptional query times when executing standard SQL aggregation queries. It can function as the aggregator and final resting place of logs in a centralized logging environment. It is the logical facilitator of enterprise-wide logging analytics.
- Data retention compliance
-
With Raijin’s expression-based partitioning, you can create partitions dynamically based on a combination of date and other columns. Dynamic partitioning enables the precise selection of records to be purged based on your specific data retention requirements. For further details, including examples showing how easy it is to automate this process, see the Purging data guide in the Raijin Database Engine User Manual.
Summary
After looking at the benefits of storing log data in a database, we established some basic database features needed for effectively managing logs and gleaning analytics from their data, with both Raijin and Elasticsearch as contenders for handling these tasks.
The performance measured in this limited set of benchmarks may not be conclusive regarding overall capabilities since database engines are complex tools, each with its own design goals and optimizations for a set of tasks. However, given the challenge of finding the best overall database engine for collecting and aggregating logs in a centralized logging environment, we can only conclude that Raijin has a definite edge over Elasticsearch. Our criteria for this decision rely not only on the "must have" features we introduced early on but also on the everyday tasks that larger organizations engage with. For example, such engagements might be real-time high-performance log aggregation and data retention compliance mandates.
Raijin may be the new kid on the block and may not provide all the functionality other database engines have yet.
Still, no single database engine is the perfect choice for every use case imaginable.
If you want to collect logs in a database, why not try them both yourself?
Go download Elasticsearch and set it up.
Then download Kibana and set it up.
Send Elasticsearch a relatively large set of events from your log sources, run some aggregation queries with a GROUP BY clause, and make notes of your overall experience.
Then download Raijin and follow the Quickstart guide.
Send Raijin the same logs you sent Elasticsearch, and run the same aggregation queries.
Let us know which one was easier for you to deploy and how they integrated with your log sources.
Please share your experience with us regarding the differences between both solutions regarding data ingestion and running queries.
