
When users start reporting slow responses or intermittent errors from your web applications, your first go-to is your web server logs. But did you know those same logs can provide more than just troubleshooting clues? When analyzed with the right tools, they give system administrators and DevOps teams real-time visibility into your web environment, enabling them to monitor web servers proactively, rather than reactively.
In this post, we’re going to show you how you can uncover web server performance issues and potential attacks early on by collecting NGINX access logs with NXLog Agent, transforming them into Prometheus metrics, and visualizing them with Grafana.
This article continues our series on log visualization. In our previous posts, we explored Visualizing OpenVPN logs and Windows security monitoring with Elasticsearch and Kibana. Now, we’ll shift focus to web infrastructure monitoring and how transforming log data into actionable observability helps your team drive better performance and security awareness.
Why monitor web access logs?
Web access logs are more than a record of HTTP requests. They capture valuable details about client requests, server responses, and overall traffic patterns. Monitoring these logs provides insight into three key areas:
- Performance monitoring
-
Metrics such as response time, request rate, and error frequency help you identify problematic endpoints, resource shortages, and performance issues before they impact users. Instead of reacting to complaints, track service health in real time and optimize your web applications proactively.
- Operational visibility
-
Web access logs provide you with a clear view of your web environment’s activity. You can monitor traffic peaks, identify your busiest endpoints, and observe which regions the traffic is coming from. This operational awareness helps with capacity planning and troubleshooting unexpected changes in traffic patterns.
- Security awareness
-
Web access logs often contain the first signs of malicious activity, such as failed login attempts, scanning for vulnerabilities, and unusual bursts of traffic. Visualizing this data helps you spot anomalies and respond to potential attacks early on. Regularly monitoring web traffic also helps you establish a baseline for normal activity, making it easier to detect deviations.
Understanding NGINX access logs
NGINX generally writes its access logs to the /var/log/nginx/access.log file on Linux and the C:\nginx\logs\access.log file on Windows.
It records every request as a single line of text containing information such as:
-
Client IP address — who made the request.
-
Request timestamp — when the request was made.
-
HTTP request method and URL — the endpoint requested.
-
HTTP status code — the server’s response.
-
Response size — data sent back to the client in bytes.
-
User agent — the application that made the request.
For example, a web access event may appear as follows:
151.189.176.84 - - [12/Oct/2025:10:14:23 +0200] "GET /october-2025-newsletter HTTP/2.0" 404 18240 "-" "Mozilla/5.0 (Windows NT 10.0; Win64; x64)"Breaking it down:
-
151.189.176.84— the client IP address. -
12/Oct/2025:10:14:23 +0200— the request timestamp. -
GET— the HTTP request method. -
/october-2025-newsletter— the URL. -
404— the HTTP status code, in this case,Not Found. -
18240— the response size. -
Mozilla/5.0 (Windows NT 10.0; Win64; x64)— the user agent.
NGINX also allows you to define custom log formats and include additional fields to expose deeper insights. For simplicity’s sake, we will stick to the default log format in this blog post.
Collecting NGINX access logs and converting them to Prometheus metrics
NXLog Agent is a lightweight, cross-platform log collection agent that can parse raw NGINX access logs and convert them into Prometheus metrics. Here is how we can approach this:
-
Use the File input module to collect the NGINX access log.
-
Parse the log records using a regular expression.
Prometheus is built for time-series data, making it an ideal choice for monitoring web server metrics. NXLog Agent provides a dedicated Prometheus output module, which exposes processed telemetry data as metrics in Prometheus exposition format.
Here is the complete configuration:
<Input nginx_access>
    Module         im_file
    File           '/var/log/nginx/access.log'
    <Exec>
        if $raw_event =~ /(?x)^(\S+)\ \S+\ (\S+)\ \[([^\]]+)\]\ \"(\S+)\ (.+)
                          \ HTTP\/\d\.\d\"\ (\S+)\ (\S+)\ \"([^\"]+)\"
                          \ \"([^\"]+)\"/ {
            $ipAddress = $1;
            if $2 != '-' $AccountName = $2;
            $EventTime = parsedate($3);
            $http_method = $4;
            $http_url = $5;
            $http_status_code = $6;
            if $7 != '-' $file_size = $7;
            if $8 != '-' $http_referer = $8;

            delete($raw_event);
        }

        if ($http_status_code == '200') { (1)
            drop();
        }
    </Exec>
</Input>

<Output prometheus>
    Module         om_prometheus
    ListenAddr     0.0.0.0:9464 (2)
    MappingFile    '/opt/nxlog/etc/prometheus_mappings.json' (3)
</Output>

<Route nginx_to_prometheus>
    Path           nginx_access => prometheus
</Route>| 1 | Discards records that have a 200 OK response code. |
| 2 | Exposes the Prometheus metrics via an HTTP endpoint listening on port 9464. |
| 3 | The MappingFile directive specifies the path to the JSON schema file. |
This configration requires the following schema file:
{
  "metrics": {
    "gauge": [
      {
        "name": "http_status_code",
        "labels": ["http_method", "http_url", "file_size", "ipAddress", "http_referer"]
      }
    ]
  }
}
Configuring an agent is easy with NXLog Platform. Find your agent, paste the configuration into the editor, and save your changes.
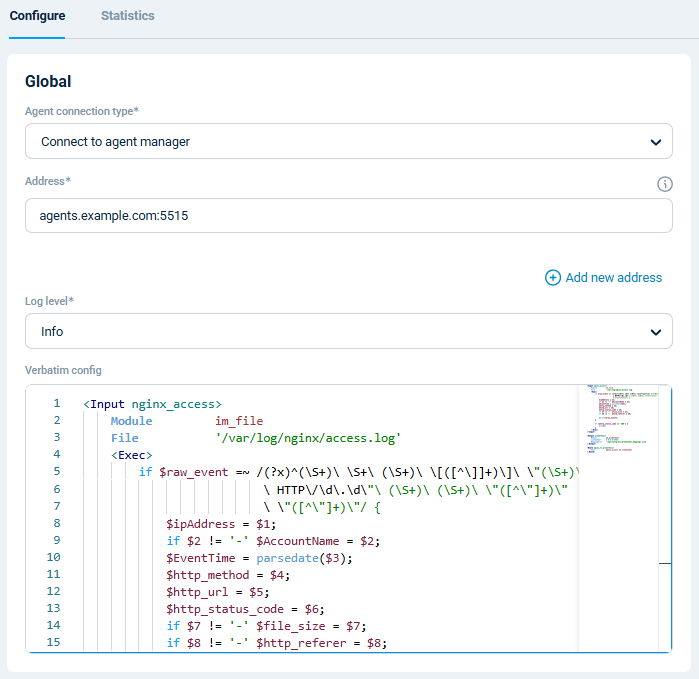
You can also create a configuration and assign it to multiple agents.
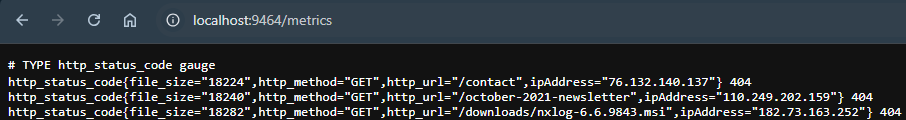
Once NXLog Agent is up and running, you can verify your configuration by accessing http://localhost:9464/metrics in a browser on the same machine where the agent is running.
To configure Prometheus to scrape this endpoint, add it to your scrape configuration. For example:
scrape_configs:

  - job_name: "WEBSRV-01"
    static_configs:
- targets: ["192.168.1.123:9464"] (1)| 1 | Replace the IP address with the NXLog Agent host’s IP address. |
By turning unstructured access logs into Prometheus metrics, you make them queryable and ready to visualize in Grafana. Let’s dive into that next.
Visualizing NGINX metrics in Grafana
Once Prometheus starts collecting metrics from NXLog Agent, you can start exploring them in its expression browser.
For example, enter http_status_code in the expression console and click Execute.
This returns a list of HTTP status codes with their respective labels.
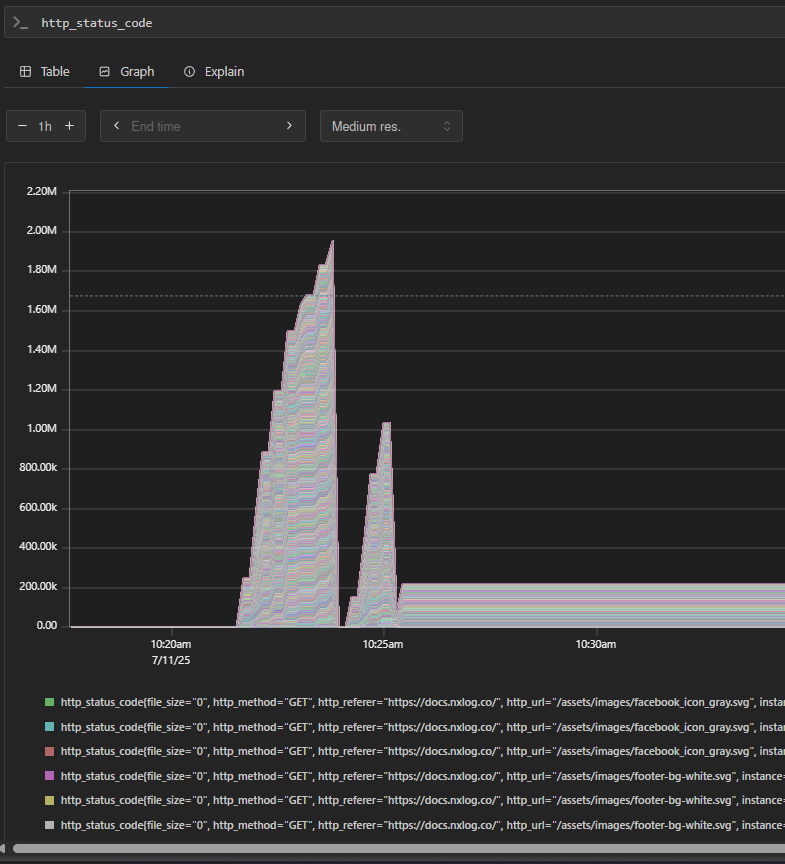
This interface is excellent for troubleshooting and validating metrics. However, the real value comes when you connect your metrics to Grafana. Grafana turns raw metrics into interactive charts and dashboards, making it easier to spot trends and anomalies at a glance. For example, you can build an NGINX dashboard with charts such as:
-
Failed requests by URL to help you identify problematic endpoints.
-
Failed requests by source IP address to easily spot potential malicious activity.
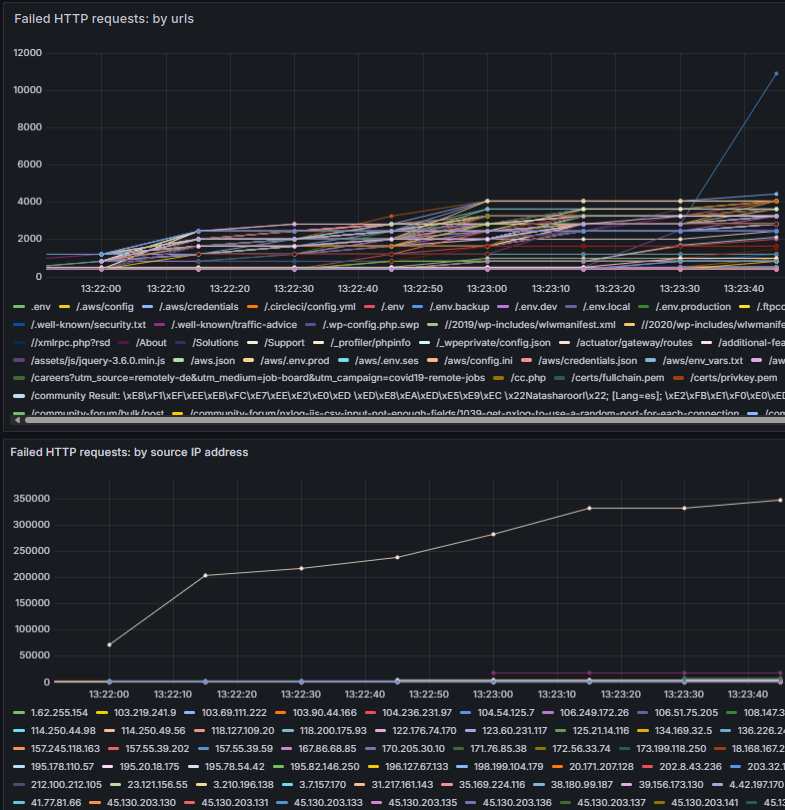
To help you get started, we prepared a Grafana dashboard with these charts.
You can import it into Grafana by navigating to Dashboards and clicking New > Import.
Then, upload the .json file, fill in the remaining fields, and click Import.
By visualizing NGINX metrics through Grafana, you gain full observability over your web server, enabling you to maintain a more reliable web service.
Conclusion
Web server access logs are one of the most valuable yet underutilized sources of telemetry data. By using NXLog Agent to collect NGINX access logs and transform them into Prometheus metrics, you can gain real-time visibility into your web environment and ensure your web services remain reliable and secure.
At NXLog, we’ve built NXLog Platform to help you get the most out of your telemetry data. If you’re ready to take your telemetry pipeline to the next level, try NXLog Agent to see how it can help you transform logs into actionable observability.
In this post, we’ve only scratched the surface of what you can achieve with an NXLog Platform, Prometheus, and Grafana stack. To learn more or discuss your specific use case, get in touch with us. Our advisors are always happy to help!
Related resources
Watch our video tutorial to explore complementary methods for collecting and forwarding NGINX access and error logs, such as receiving syslog messages over UDP or exporting agent metrics to Prometheus.