
In our previous blog post, From network logs to insights: Visualizing OpenVPN logs with Elasticsearch and Kibana, we explored how you can gain visibility into VPN activity by collecting and analyzing network logs. Windows security monitoring is another common use case we encounter at NXLog.
Windows workstations and servers generate security event logs ranging from authentication attempts and privilege escalations to policy changes and process executions. Such events can reveal external intrusions and insider threats, and for security analysts, they are the first line of evidence in investigating suspicious activity. However, these events are buried among thousands of events that relate to routine activities.
In this post, we will show you how to obtain high-quality security events from your Windows systems using NXLog Agent, and how to utilize Elasticsearch and Kibana to identify trends and patterns that your security team can act on.
Why monitor Windows security events?
If you’ve spent any time in a SOC, you already know that Windows security events are where a lot of the action starts. If you’re not collecting and monitoring these events, you’re essentially blind to the earliest possible signs of compromise.
- Detecting suspicious activity
-
Attackers rarely show up waving a banner. They quietly creep in, escalate privileges, and run processes that shouldn’t be there. Windows security logs record all of this activity, and if you’re watching, you can nip suspicious activity in the bud. The key is getting the events from your Windows machines into a system that will help you make sense of them.
- Compliance and auditing
-
Meeting regulatory mandates is non-negotiable. PCI DSS, HIPAA, ISO 27001, and other standards all require you to maintain a record of who did what and when. Windows security events provide you with that audit trail. Centralizing them means you’re not scrambling during an audit or incident review because you already have the data neatly stored and searchable. For a broader overview of IAM and access control, see our IAM guide for 2026.
- Operational efficiency
-
Collecting and aggregating Windows security events in a central location saves you from having to dig through logs on individual machines during an investigation. With a platform like Elasticsearch and Kibana, you can correlate, filter, and visualize what’s happening across your environment. That is how your security team can remain focused on analysis, accelerating response times.
Key Windows security events to monitor
As we’ve already established, not every Windows event is worth your attention. However, certain events deliver high-value signals when it comes to detecting suspicious behavior. Focusing on the right subset of events makes all the difference.
Below is a list of key Windows security event IDs mapped to MITRE ATT&CK techniques. These events should be at the top of your priority list for monitoring.
| Category | Event IDs | MITRE Technique | Why it matters |
|---|---|---|---|
PowerShell script/module logging |
400, 403, 4100, 4102, 4103, 4104, 4105, 4106 |
PowerShell abuse is one of the most common attacker techniques. These events capture script block logging, module loads, and execution. |
|
Process creation (e.g., cmd.exe, powershell.exe) |
4688 |
Tracks new processes being created, which is essential for spotting suspicious shells, LOLBins, and living-off-the-land activity. |
|
New service installed |
4697, 7045 |
Attackers often install services for persistence. These events tell you when that happens. |
|
Scheduled Task operations |
4698, 4699, 4700, 4701, 4702 |
Scheduled tasks are another persistence favorite. These events track creation, deletion, and modification. |
|
Privileged group membership changes |
4728, 4729, 4732, 4733, 4735, 4737 |
Unauthorized changes to privileged groups are a red flag for privilege escalation or persistence. |
|
Group Policy / GPO modifications |
4739, 5136 |
Attackers with domain privileges may alter GPOs to weaken defenses or deploy malicious settings. |
|
Admin rights or privilege escalation |
4672, 4673, 4964 |
Indicates assignment of special privileges, often abused to gain elevated access. |
|
USB device connect/install |
6416, 6424 |
Detects removable media connections, useful for spotting data exfiltration attempts or policy violations. |
|
NPS (RADIUS) authentication logs |
6272, 6273, 6274 |
Tracks successful and failed authentications via RADIUS. This is important in environments using NPS for VPN or Wi-Fi access. |
|
WMI operation logging |
5857, 5858 |
WMI is a powerful attacker tool for lateral movement and execution. These events capture key activity. |
|
Security log cleared |
1102 |
When attackers clear the log, they’re trying to cover their tracks. This is always worth an alert. |
|
Logon success/failure and explicit credentials |
4624, 4625, 4648 |
Core authentication events that reveal brute-force attempts, suspicious logons, and use of explicit credentials. |
Collecting Windows security events and sending them to Elasticsearch
NXLog Agent is a lightweight, cross-platform log collection agent that seamlessly integrates with the Windows Event Log API to collect, filter, and parse Windows events. Acting as a bridge between your Windows infrastructure and analytics stack, it can normalize fields and output data in JSON format, making them immediately useful for viewing in Elasticsearch. Here is how we can go about it:
-
Use the Windows Event Log input module to collect Windows security events. This module supports QueryXML filters, which are perfect for collecting the subset of events we defined above.
-
Convert the records to JSON format.
Elasticsearch can handle high data volumes at scale and is capable of indexing data fast, which is what you need for monitoring Windows security events. NXLog Agent can forward events directly to it using its dedicated Elasticsearch output module, ensuring that logs are stored correctly and ready to query in near real-time.
Here is the complete configuration:
GenerateDateInUTC        TRUE (1)
ParseDateInUTC           TRUE

define PowerShellExecutionEvents 400, 403, 4100, 4102, 4103, 4104, 4105, 4106
define ProcessCreationEvents 4688
define ServiceAbuseEvents 4697, 7045
define ScheduledTaskEvents 4698, 4699, 4700, 4701, 4702
define GroupMembershipChangeEvents 4728, 4729, 4732, 4733, 4735, 4737
define GroupPolicyChangeEvents 4739, 5136
define PrivilegeEscalationEvents 4672, 4673, 4964
define USBActivityEvents 6416, 6424
define NPSEvents 6272, 6273, 6274
define WMIActivityEvents 5857, 5858
define LogClearEvents 1102
define AuthenticationEvents 4624, 4625, 4648

<Extension json>
    Module               xm_json
</Extension>

<Input windows_events>
    Module               im_msvistalog
    TolerateQueryErrors  TRUE
    ResolveGUID          TRUE
    ResolveSID           TRUE
    Language             en-US
    <QueryXML>
        <QueryList>
            <Query Id="0" Path="Security"><Select>*</Select></Query>
            <Query Id="1" Path="Microsoft-Windows-PowerShell/Operational"><Select>*</Select></Query>
        </QueryList>
    </QueryXML>
    <Exec>
        if ($EventID NOT IN (%PowerShellExecutionEvents%)) and
           ($EventID NOT IN (%ProcessCreationEvents%)) and
           ($EventID NOT IN (%ServiceAbuseEvents%)) and
           ($EventID NOT IN (%ScheduledTaskEvents%)) and
           ($EventID NOT IN (%GroupMembershipChangeEvents%)) and
           ($EventID NOT IN (%PrivilegeEscalationEvents%)) and
           ($EventID NOT IN (%USBActivityEvents%)) and
           ($EventID NOT IN (%NPSEvents%)) and
           ($EventID NOT IN (%WMIActivityEvents%)) and
           ($EventID NOT IN (%LogClearEvents%)) and
           ($EventID NOT IN (%AuthenticationEvents%)) {
           drop(); (2)
        }
        to_json();
    </Exec>
</Input>

<Output elasticsearch>
    Module               om_elasticsearch
    URL                  http://172.19.113.201:9200/_bulk (3)
</Output>

<Route windows_events_to_elasticsearch>
    Path                 windows_events => elasticsearch
</Route>| 1 | Generates and expects dates in UTC. |
| 2 | Discards events that are not in the list. |
| 3 | Replace the IP address and port with your Elasticsearch instance details. |
Configuring an agent is easy with NXLog Platform. Find your agent, paste the configuration into the editor, and save your changes.
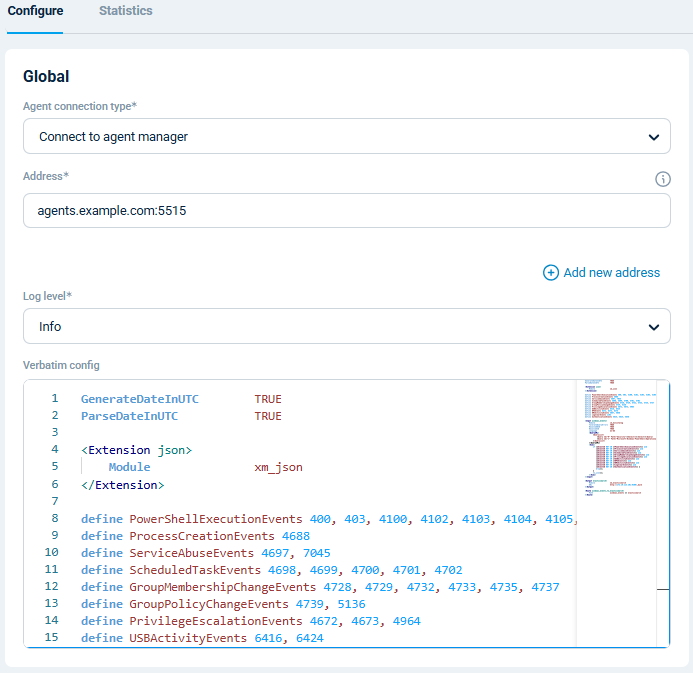
You can also create a configuration and assign it to multiple agents.
With NXLog Agent handling collection and Elasticsearch providing scalable storage and search, you have a pipeline that turns raw Windows security events into actionable insights in Kibana. Let’s look at that next.
Visualizing Windows security logs in Kibana
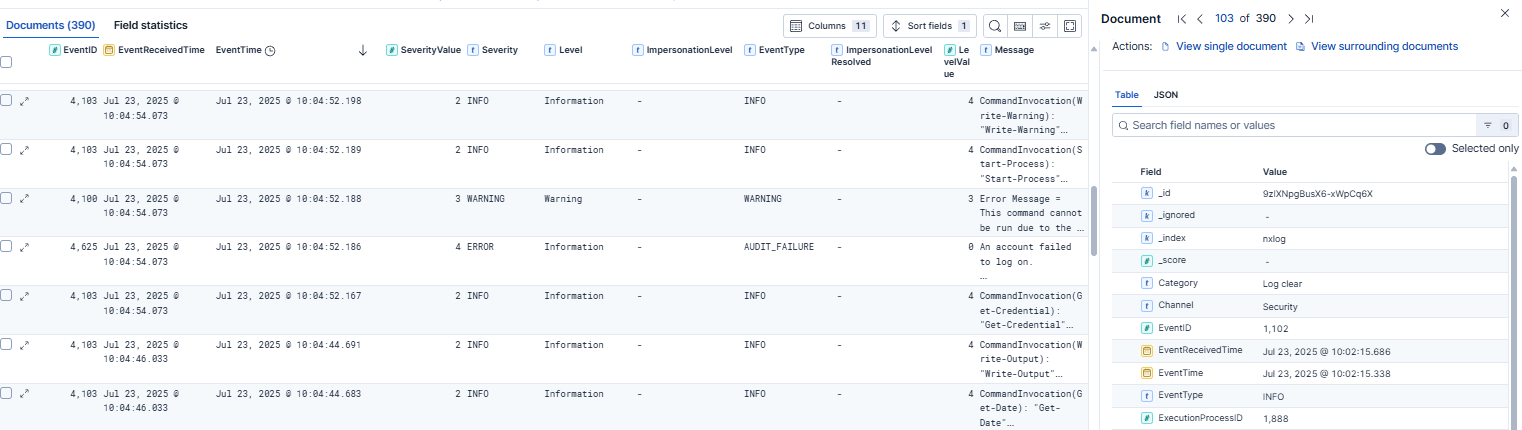
Once your Windows security events are indexed in Elasticsearch, you can immediately start exploring them in the Discover page, which lets you search and filter raw events in real time. This is particularly useful for ad hoc investigations, such as examining a suspicious logon or tracing the sequence of events leading up to an alert.
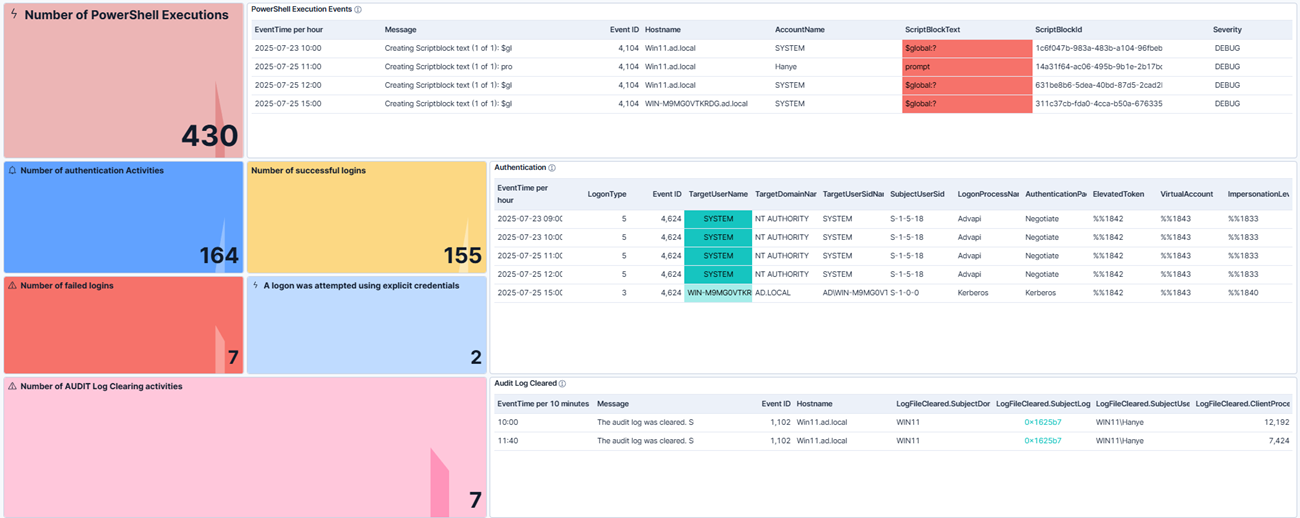
Beyond ad hoc searches, the real power of Kibana lies in dashboards. By visualizing your data, you can transform Windows security events into clear, actionable insights. For example, you can build a Windows security events dashboard including widgets such as:
-
Number of successful and failed logins to spot brute-force attempts or abnormal login behavior.
-
Assigned special privileges to visualize where and when special privileges are being assigned.
-
Process creation patterns to identify unusual process activity that may signal malware or living-off-the-land tactics.
-
Audit log cleared activity to highlight a potential attacker covering their tracks.
…and much more!
To make it easy for you, we’ve prepared a comprehensive Kibana dashboard.
You can import it into Kibana by navigating to Stack Management and then clicking on Saved Objects under Kibana.
Then, click Import and upload the .ndjson file.
These types of visualizations give you a real-time view of Windows security activity across your environment, supporting your day-to-day monitoring and providing context during incident response.
Conclusion
Windows security events are one of the richest sources of evidence for security monitoring. However, extracting logs from individual systems, reducing noise, and transforming them into actionable information is challenging without the right tools. By using NXLog Agent to collect and forward events into Elasticsearch and leveraging Kibana dashboards, you can build a telemetry monitoring pipeline that delivers visibility to your security analysts.
At NXLog, our passion is helping organizations get real value from their telemetry data, and we’ve built NXLog Platform with that in mind. If you’re ready to improve visibility into your Windows environment, try NXLog Agent and see how it can help you streamline event collection and route data to Elasticsearch and Kibana.
And keep an eye on this blog. We’ll be publishing more guides on processing and visualizing logs from other technologies in the near future. If there are any specific technologies you would like us to cover, let us know. We’re always listening!