
What are performance metrics and why are they important?
IT and security systems don’t just generate logs; they also produce extremely valuable performance data that helps ensure the health and stability of your business infrastructure. Host-level performance metrics provide visibility into key resources, such as:
-
CPU usage — Helps identify over-utilization, process bottlenecks, or underused resources.
-
Memory usage — Indicates whether applications are consuming excessive RAM or leaking memory over time.
-
Disk usage and I/O — Shows storage availability and performance—critical for database servers and applications with heavy read/write activity.
-
And much more besides.
Tracking these metrics allows administrators to detect issues early, plan for scaling, and troubleshoot performance degradations before they impact end users.
Collecting logs and metrics: multi-instrumentation overhead
Traditionally, organizations have had to rely on multiple different agents to capture logs and system metrics. For example:
-
A log collector agent to ingest application and system logs
-
A separate metrics exporter to gather CPU, memory, disk, and network statistics
-
A monitoring agent/collector to format data and relay to a time-series database, SIEM or other centralized analytics solution, and so on.
This approach works. But it comes with downsides. These include increased resource usage on hosts, higher administrative overheads, and added complexity in terms of configuration management. Maintaining and upgrading multiple agents often means more potential points of failure.
A single telemetry agent solution: NXLog Platform
With NXLog Platform, you can now gather both logs and metrics in one place. This means you can unify log and performance data collection under a single, lightweight, and flexible agent and relay metrics to a system of your choice without the need for third-party agent software. The Prometheus time-series database is one popular option.
With new metrics management capabilities:
-
Host metrics, such as CPU load, memory utilization, and disk statistics, can be gathered by NXLog Agent.
-
Metrics can be exposed in native Prometheus format, making integration straightforward.
-
Logs and metrics are managed by a single configuration, reducing operational complexity.
This approach simplifies telemetry pipeline management by replacing multiple exporters and log shippers with a unified agent. In return, organizations benefit from lower overheads, consistent configuration management, and easier scaling.

Eager to learn how to build an application performance monitoring dashboard with Prometheus, Grafana and NXLog Platform?
Quick how-to: Collecting host metrics to Prometheus with NXLog Platform
If you ever need to monitor host and application performance, a Prometheus and Grafana stack would, without a doubt, be your first choice. Prometheus is a time-series database solution that allows users to scrape, store and analyze metrics, while Grafana is a popular native tool for visualizing data from Prometheus. In order to ingest data into Prometheus, it requires an additional layer—for instance, a metrics exporter—that is capable of exposing data to Prometheus. NXLog Platform is that extra layer.
But what kind of data, exactly, needs to be exposed? With NXLog Platform, it’s possible to extract different kinds of system performance information via OSQuery. So, for example, you might begin by setting up the collection of network statistics, HDD, CPU and RAM usage.
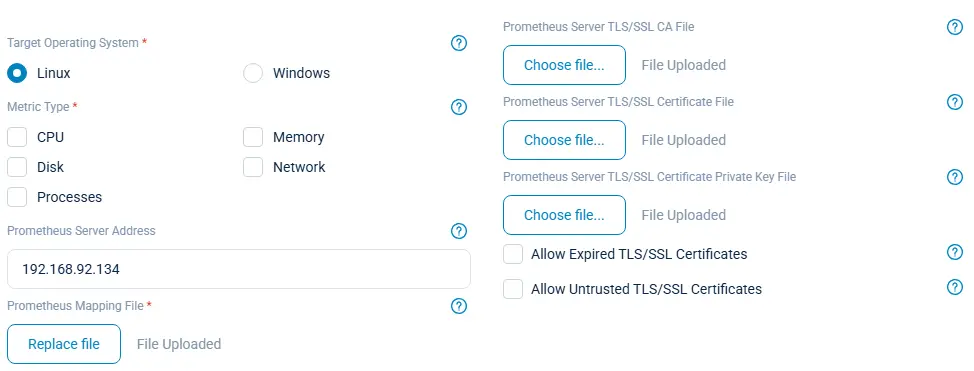
With NXLog Platform, every configuration step can be easily actioned with the respective OSQuery to Prometheus Solution Pack:
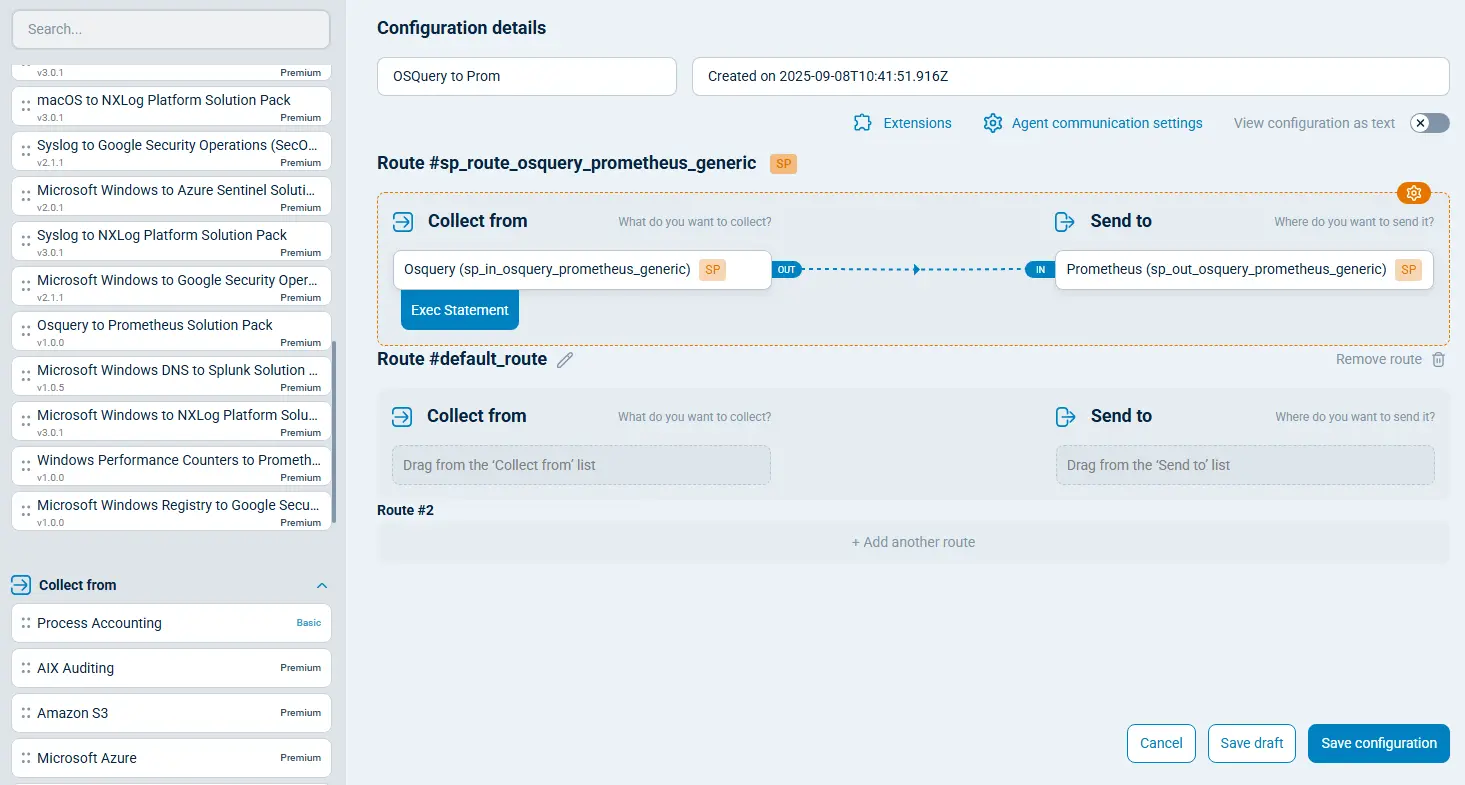
For illustrative purposes, this article will explain how to set up configuration manually, step-by-step.
Firstly, we need to prepare a configuration sample that does the following things:
-
Collects the data required (via
im_osquerymodule) -
Converts the data to metrics
-
Exposes the data (via
om_prometheusmodule) to the network for Prometheus to scrape metrics from
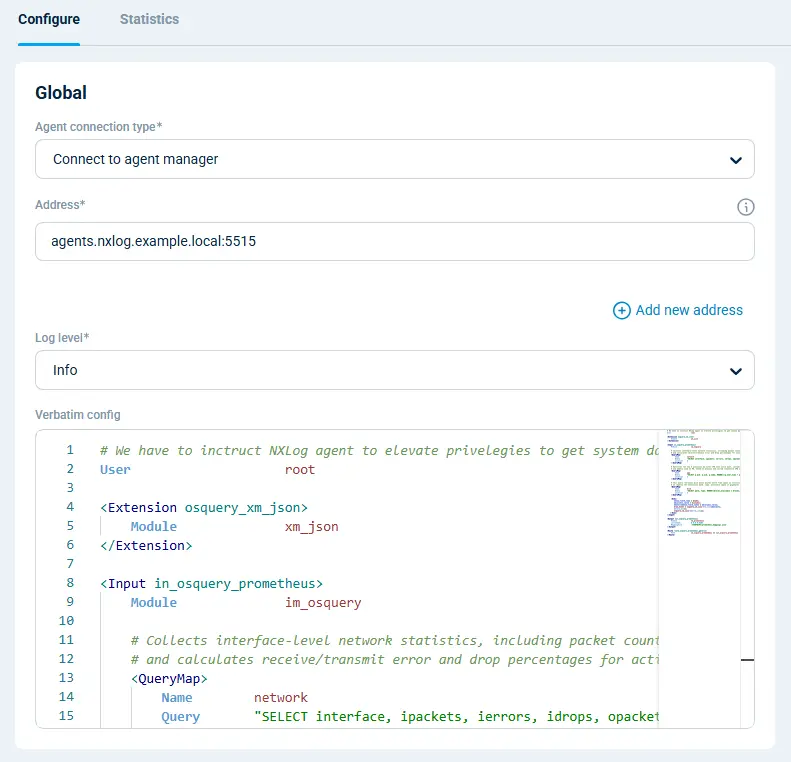
Here’s how that works:
# We have to instruct NXLog Agent to elevate privileges to get system data
User                    root

<Extension osquery_xm_json>
    Module              xm_json
</Extension>

# Setting up osquery requests
<Input in_osquery_prometheus>
    Module              im_osquery

    # Collects interface-level network statistics, including packet counts, errors, and drops,
    # and calculates receive/transmit error and drop percentages for active interfaces.
    <QueryMap>
        Name        network
        Query       "SELECT interface, ipackets, ierrors, idrops, opackets, oerrors, odrops, collisions, ROUND((ierrors * 100.0) / ipackets, 2) AS rx_error_pct, ROUND((idrops * 100.0) / ipackets, 2) AS rx_drop_pct, ROUND((oerrors * 100.0) / opackets, 2) AS tx_error_pct, ROUND((odrops * 100.0) / opackets, 2) AS tx_drop_pct FROM interface_details WHERE ipackets > 0 OR opackets > 0"
        Interval    5
    </QueryMap>

    # Retrieves the top 5 processes by total CPU time since boot, including estimated CPU usage percentage (cpu_usage_percent_since_boot).
    # and memory used in MB, based on process and system cumulative CPU statistics (memory_used_mbyte).
    <QueryMap>
        Name        app
        Query       "SELECT p.pid, p.uid, p.name, ROUND(((p.user_time + p.system_time) / (ct.tsb - ct.itsb)) * 100, 2) AS cpu_usage_percent_since_boot, ROUND((p.total_size * 1e-6), 2) AS memory_used_mbyte FROM processes p, (SELECT (SUM(user) + SUM(nice) + SUM(system) + SUM(idle) * 1.0) AS tsb, SUM(COALESCE(idle, 0)) + SUM(COALESCE(iowait, 0)) AS itsb FROM cpu_time) AS ct ORDER BY (p.user_time + p.system_time) DESC LIMIT 5"
        Interval    5
    </QueryMap>

    # This query retrieves disk mount points where free space is critically low (<5%).
    # It reports the filesystem path, type, available space in gigabytes (free_gb), and free percentage (free_percent).
    <QueryMap>
        Name        disk
        Query       "SELECT path, type, ROUND((blocks_available * blocks_size * 10e-10), 2) AS free_gb, ROUND((blocks_available * 1.0 / blocks) * 100, 2) AS free_percent FROM mounts WHERE (blocks_available * 1.0 / blocks) * 100 < 5"
        Interval    5
    </QueryMap>

    <Exec>
       $$new_field_name = $name;
       $$columns_value = $columns;
       $$event($$new_field_name) = $$columns_value;
       $raw_event = osquery_xm_json->to_json($$event);
       delete_all();
       osquery_xm_json->parse_json();
   </Exec>
</Input>

# Expose metrics to the network
<Output out_osquery_prometheus>
    Module              om_prometheus
    ListenAddr          0.0.0.0:9464
    MappingFile         '%CONFDIR%/prometheus_mappings.json'
</Output>

<Route route_osquery_prometheus_generic>
    Path                in_osquery_prometheus => out_osquery_prometheus
</Route>
Add the following chunk to your agent’s configuration in NXLog Platform, and it will do the job for you:
Notice that, to convert the data, we use a prometheus_mappings.json mapping file, which enables us to add the necessary metric labels.
In the example below, we define only the mappings we need, but it’s possible to add more.
This file has to be placed into NXLog Agent’s configuration /opt/nxlog/etc/nxlog.d folder at the target host:
{
  "metrics": {
    "counter": [
      {
        "name": "network_ipackets",
        "labels": ["network_interface"]
      }
    ],
    "gauge": [
      {
        "name": "app_cpu_usage_percent_since_boot",
        "labels": ["app_pid","app_uid","app_name"]
      },
      {
        "name": "app_memory_used_mbyte",
        "labels": ["app_pid","app_uid","app_name"]
      },
      {
        "name": "disk_free_gb",
        "labels": ["disk_path","disk_type"]
      },
      {
        "name": "disk_free_percent",
        "labels": ["disk_path","disk_type"]
      }
    ]
  }
}
Next, restart the agent, and you’ll find it ready to use, with NXLog Platform now able to collect your metrics and expose them at [nxlog_agent_host:9464] in a Prometheus-compatible format.
Now it’s time to tweak Prometheus itself to scrape the data and configure it to Grafana dashboards for visualization.
NXLog Platform provides native integration with Prometheus.
So, it’s as easy as adding this next information into the scrape_configs section of your prometheus.yml configuration file:
scrape_configs:

  - job_name: "unix-nxlog"
    static_configs:
      - targets: ["192.168.92.134:9464"]
Ensure you specify the IP address of the target host you want the metrics to be taken from (192.168.92.134 in my case). Prometheus should now be ready for continuous metric collection.
The last task to complete your setup is to visualize the data using Grafana.
Let’s add a new dashboard specifying Prometheus as a data source and app_cpu_usage_percent_since_boot metric as the data itself:
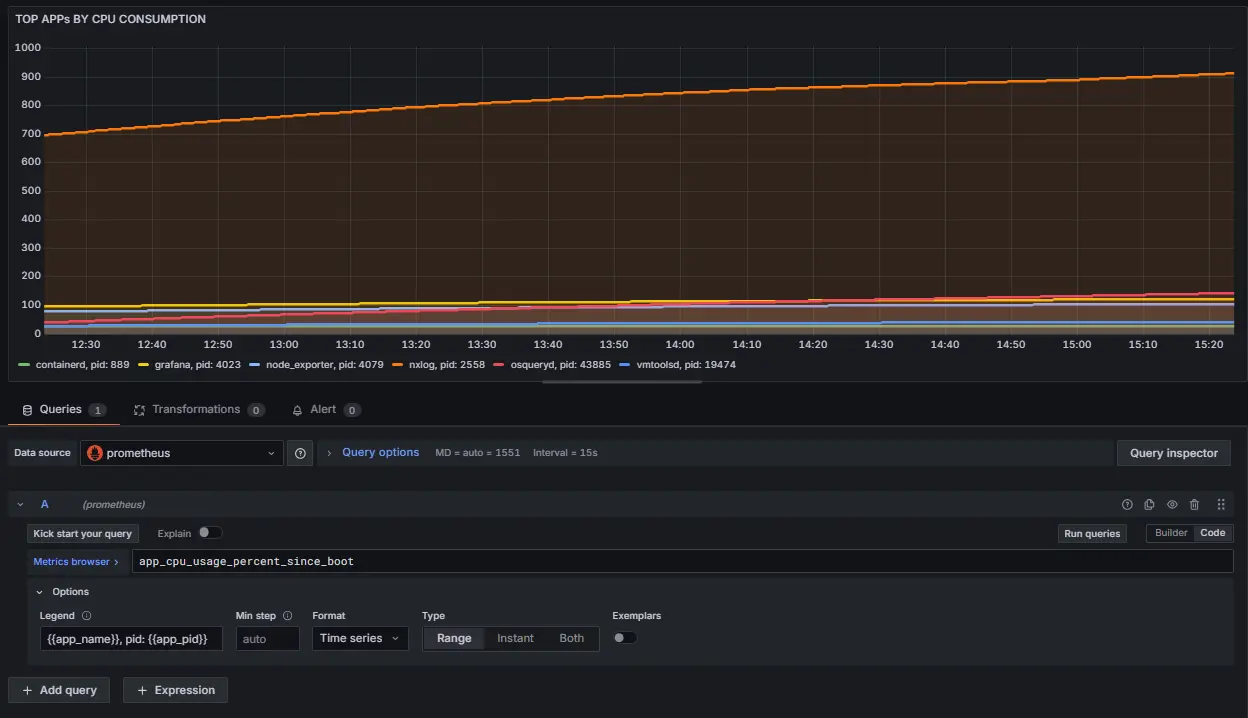
Now, we can easily check for the processes that consume the most CPU over time.
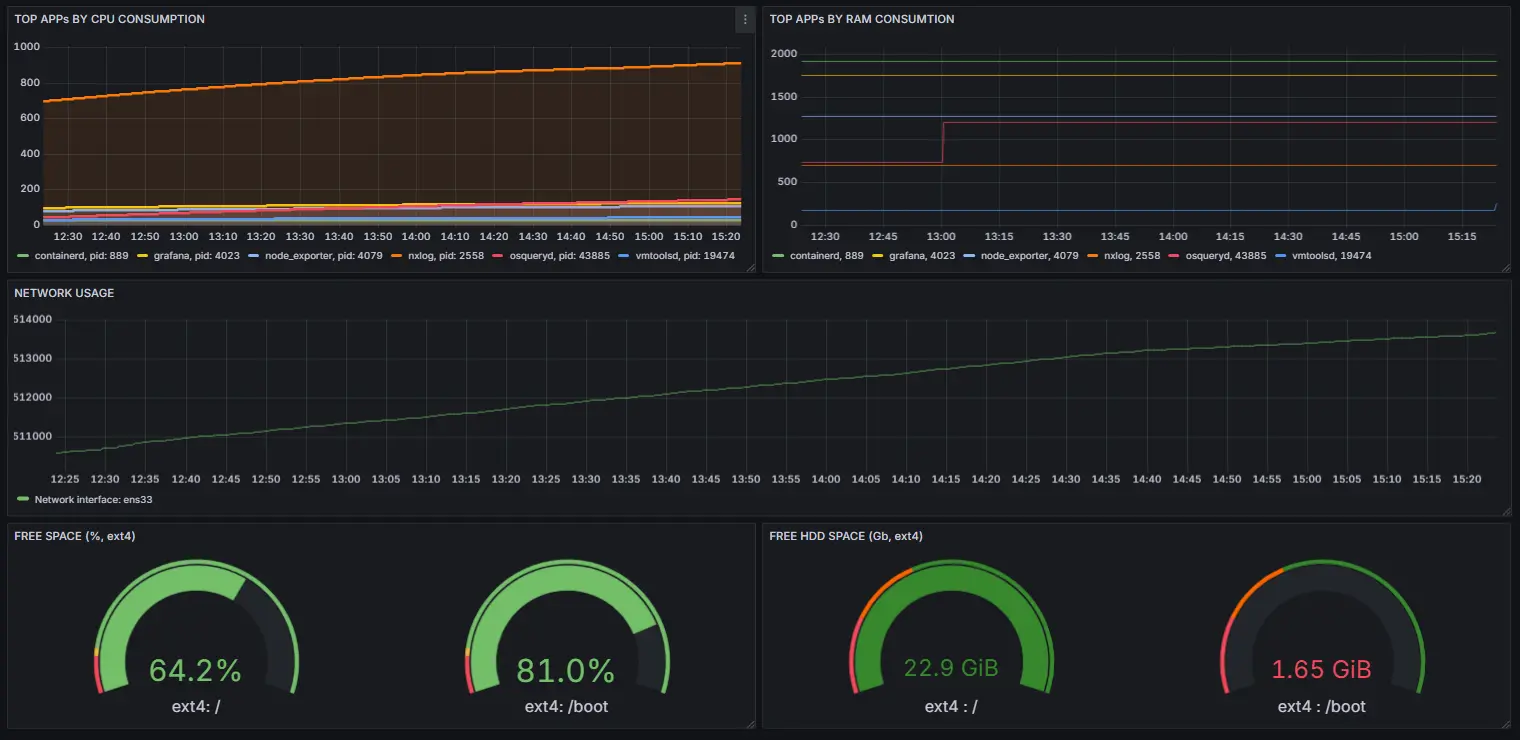
Next, add the additional visualizations for disk_free_gb, disk_free_percent, app_memory_used_mbyte and network_ipackets metrics to make your brand-new application performance monitoring dashboard more sophisticated:
Bringing it all together
By combining log collection and performance metric management, NXLog Platform provides a unified telemetry and observability agent layer. You can send logs to your SIEM while simultaneously exposing host metrics to Prometheus for continuous monitoring—without deploying extra software.
In short, the results you’ll get are:
-
Fewer agents on your systems
-
Lower resource usage
-
Centralized management of logs and metrics
-
Seamless integration with Prometheus
NXLog Platform gives you the complete picture of your infrastructure health, without the complexity. Speak to an NXLog Advisor to book your trial today.