
We are happy to announce the latest release of NXLog Platform, version 1.9. This version transforms how you manage observability by combining metrics and logs in one platform, optimizing agent management workflows, and enabling enterprise-grade deployments for modern infrastructures.
Want a quick overview? Watch a short demo showcasing the new features in this release:
Read on for more details about these updates.
Metrics made simple
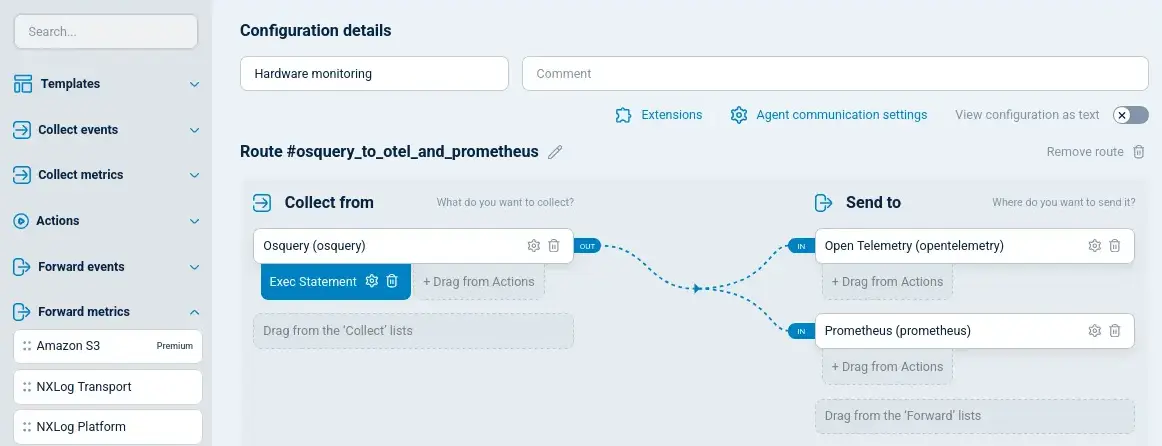
NXLog Platform provides built-in support for all types of telemetry data, including metrics. Just like with events, you can also use NXLog Platform to configure metrics collection, processing, and forwarding directly from the UI without needing separate tools or incurring extra costs.
In addition, NXLog Agent 6.10 includes the improved OpenTelemetry Exporter module that can actively forward system and health metrics to any OpenTelemetry backend. With this effortless integration into your OpenTelemetry observability stack, you gain real-time visibility even in environments where endpoint scraping isn’t possible.
Smarter agent management
This NXLog Platform release includes a series of new features that make it more straightforward than ever to monitor and manage your agent fleet:
- Custom agent names
-
Assign meaningful display names to agents, such as location or department, or any available agent information field. Now, you can instantly recognize, target, and manage agents in ways that match how your team already works.
- Agent IP addresses are now visible
-
It’s now possible to view the IP address where agents are connecting from, as well as the last known IP address for offline agents. This is useful to quickly identify and troubleshoot the host systems running NXLog Agent.
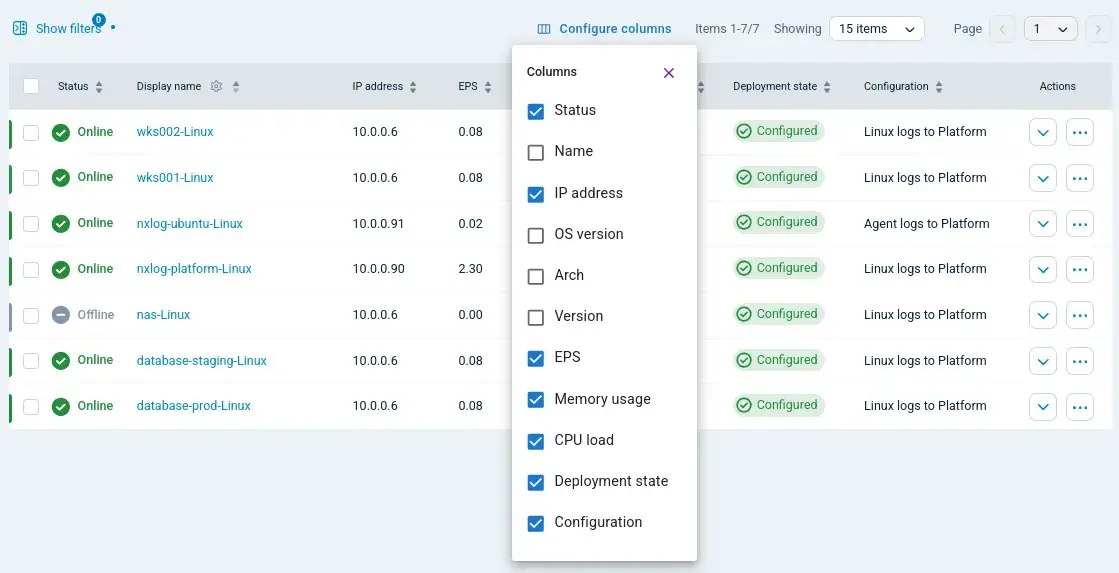
- Enhanced and customizable agent list
-
The agent list now allows you to choose and order the columns with the agent information that matters most to you, such as agent name, connection IP address, NXLog Agent version, host operating system, status, and more. Using a personalized view that matches your needs allows you to identify agents faster and make decisions with confidence.
Log flow now fully released
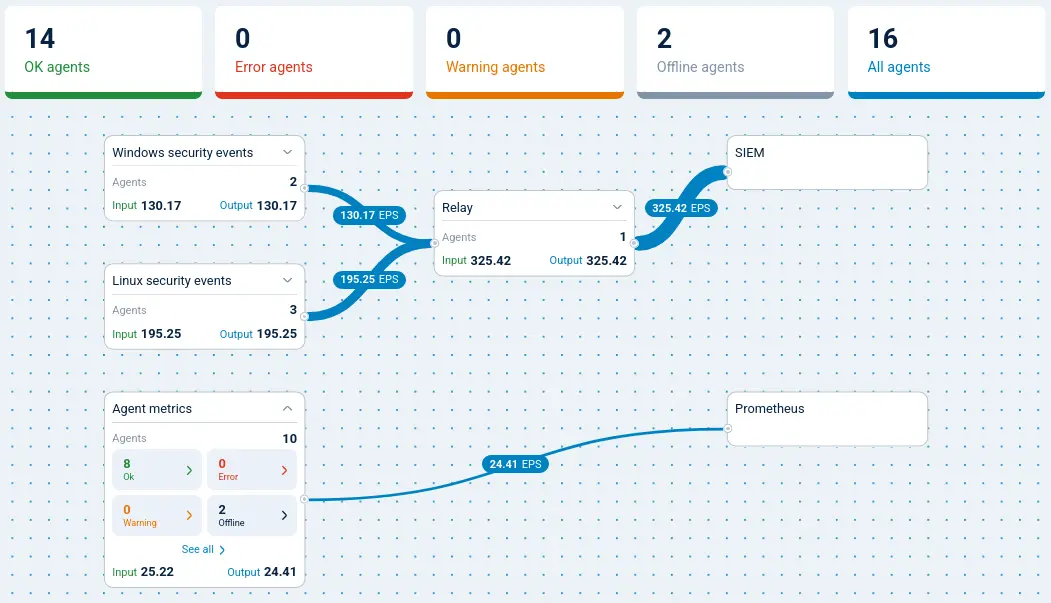
Log flow is now out of beta and available directly from the sidebar menu, bringing full visibility to every customer.
Visualize how data flows in real-time through your ingestion pipeline by tracking EPS, agent status, and connection counts, and obtain insights to help you optimize and troubleshoot configurations. For example, you can identify potential bottlenecks or spot connectivity issues at a glance and act immediately to remediate them.
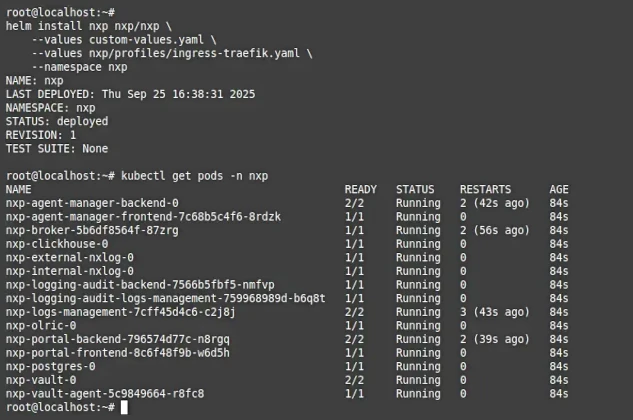
Enterprise-ready Kubernetes deployment
NXLog now provides a Helm chart for conveniently deploying NXLog Platform on a Kubernetes cluster with the tools you are already familiar with. This makes it easier to integrate NXLog Platform with your existing CI/CD workflows, reducing complexity and supporting modern DevOps practices.
Simpler upgrades
The NXLog Platform upgrade command now accepts both "Y/N" and "Yes/No" inputs, giving users up to three retries before halting. This improves everyday usability by making upgrades smoother and less error-prone.
Find out more
Our release notes include all of the new features and fixes. Our comprehensive documentation provides additional details. Contact us below if you need help upgrading, have a feature request, or have any other questions.