
OpenTelemetry promises a vendor-neutral standard for observability, consistent telemetry, and the flexibility to change backends without rewriting everything. In practice, however, OpenTelemetry adoption often runs into a familiar obstacle: reality.
Here’s a common scenario. You’re eager to improve observability, but your environment includes a mix of legacy applications, network devices, and third-party systems. Many of these were never designed for modern instrumentation, and changing them is risky, expensive, or simply not an option.
This is where OpenTelemetry adoption tends to stall. But the assumption that observability must start inside the application is a common misconception. Most applications already produce logs that contain valuable operational and security signals. In many environments, the most practical solution is to achieve observability without application changes by converting those logs into OpenTelemetry.
Why application-level changes are not the answer
Many environments still depend on legacy applications that are business-critical but are no longer maintained. Others rely on third-party systems where instrumentation is simply not possible. Even when the source code is available, the risk of introducing regressions and potentially disrupting the business often make application-level changes a no-go.
Replacing or updating applications to support observability is expensive and does not deliver immediate business value. It can involve lengthy testing, operational downtime, and coordination across multiple teams, making it harder to justify.
However, application instrumentation is not the only answer. These same systems already generate valuable telemetry data in the form of logs. Application logs, syslog messages, and event streams capture authentication attempts, configuration changes, errors, and state transitions, all of which are essential for troubleshooting and security monitoring.
You already have the data. The solution: transform it into a format compatible with modern observability frameworks.
Converting logs instead of rewriting applications
When updating applications isn’t realistic, the alternative is to work with the data they already produce. You can collect logs externally and transform them into OpenTelemetry in a controlled, repeatable way.
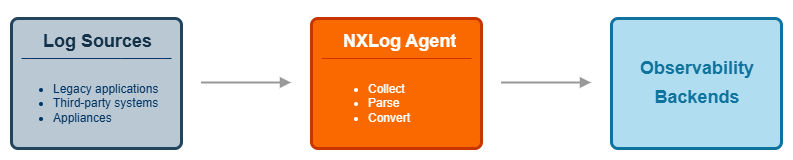
This approach starts by collecting data from the source log file, stream, or database. Next, the data is parsed to extract meaningful fields, normalized to a consistent OpenTelemetry structure, and enriched with additional context such as host information, environment metadata, or severity level. Finally, the processed data can be forwarded to any backend that supports OpenTelemetry.
This approach brings immediate benefits:
-
Since collection and conversion occur externally, there is no risk to your applications. Your team can adopt OpenTelemetry incrementally without interrupting business operations.
-
Enriching and standardizing your data improves quality and consistency across systems.
-
Just as important, this method allows you to remain vendor-neutral, where OpenTelemetry is an interface, not a limitation.
Using NXLog Agent as the conversion layer
Putting log conversion into practice requires a reliable layer that can collect telemetry data from diverse sources, understand legacy and custom log formats, and translate them into OpenTelemetry. NXLog Agent is designed from the ground up for this purpose. Out of the box, it can collect and parse logs from a wide range of inputs, including syslog, Windows Event Log, and macOS ULS. It also provides all the tools you need to process custom log formats, including regex-based parsing, pattern-matching, and schema definitions. From there, the OpenTelemetry Exporter module can forward data downstream.
This approach preserves flexibility and operational control. Since the log parsing and transformation logic lives outside the application, you can update it independently and roll it out in iterations as needed. You can adjust mappings, add data enrichment, or change OpenTelemetry backends without ever touching your applications. Because NXLog Agent supports multiple output formats and destinations, you remain vendor-neutral as your observability strategy evolves.
Application logs to OpenTelemetry: a practical example
To make this approach easier to adopt in real environments, NXLog Platform provides a set of OpenTelemetry templates. These templates define ready-to-use pipelines for common log sources and conversion scenarios.
| Source | Description |
|---|---|
Linux |
Collects authentication, package management, and Linux audit subsystem logs. |
Windows Event Log |
Collects Windows events, allowing you to choose the event categories you want to collect. |
macOS |
Collects macOS unified logging system (ULS) and Endpoint Security auditing system logs. |
syslog |
Collects syslog messages over TCP and UDP. |
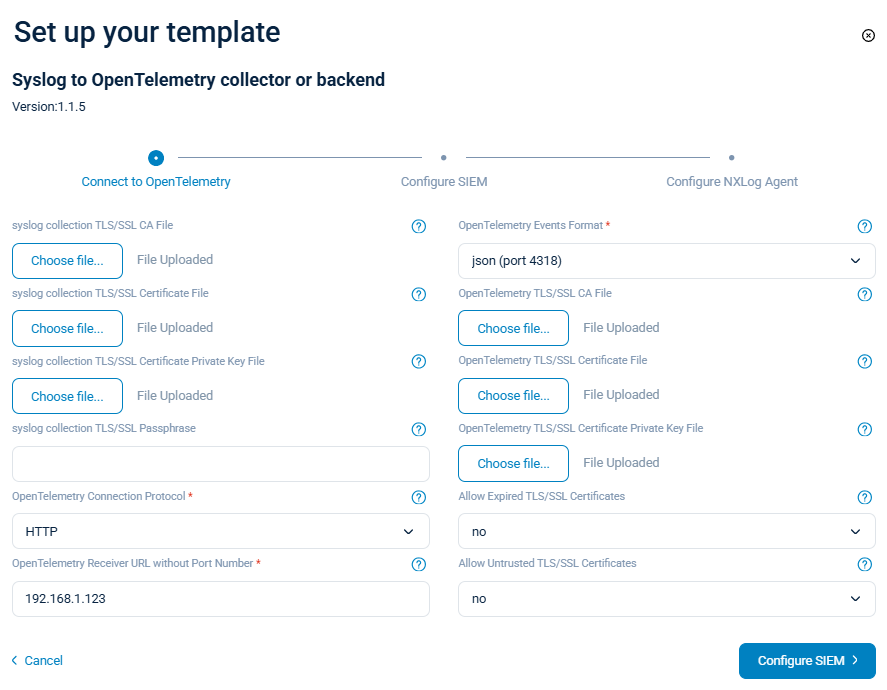
A typical example is converting syslog messages into OpenTelemetry logs. Many applications and network devices already support forwarding events in syslog format. Using the Syslog to OpenTelemetry template, NXLog Agent collects these syslog messages, parses and normalizes fields, and converts them into OpenTelemetry log records.
The template offers several configuration options, including the OpenTelemetry event format (gRPC, json, protobuf) and TLS/SSL settings for both collecting and forwarding logs to the OpenTelemetry backend.
The template contains all configurations necessary to transform syslog messages into OpenTelemetry log records. For example, consider this syslog message:
<30>Jan 23 10:10:27 SRV01 sshd[26459]: Accepted publickey for john from 192.168.1.1 port 41193 ssh2It will be converted into the following OpenTelemetry log record if you select the json event format.
{
  "timeUnixNano": "1769160108990168000",
  "observedTimeUnixNano": "1769160108990789800",
  "severityNumber": 9,
  "severityText": "INFO",
  "body": {
    "stringValue": "Severity=INFO EventTime=2026-01-23 10:10:27 attributes=( 'EventReceivedTime' => 2026-01-23 10:20:08, 'SyslogFacilityValue' => 3, 'SyslogFacility' => 'DAEMON', 'SyslogSeverityValue' => 6, 'SyslogSeverity' => 'INFO', 'SeverityValue' => 2, 'Severity' => 'INFO', 'EventTime' => 2026-01-23 10:10:27, 'ProcessID' => 26459 ) SeverityNumber=9 body='Accepted publickey for john from 192.168.1.1 port 41193 ssh2' resource=( 'Attributes' => ( 'SourceName' => 'sshd', 'SourceModuleName' => 'sp_in_syslog_tcp', 'SourceModuleType' => 'im_file', 'Hostname' => 'SRV01' ) ) "
  },
  "attributes": [
    {
      "key": "Severity",
      "value": {
        "stringValue": "INFO"
      }
    },
    {
      "key": "EventTime",
      "value": {
        "intValue": "1769160108990168000"
      }
    },
    {
      "key": "attributes",
      "value": {
        "kvlistValue": {
          "values": [
            {
              "key": "EventReceivedTime",
              "value": {
                "intValue": "1769160008573484000"
              }
            },
            {
              "key": "SyslogFacilityValue",
              "value": {
                "intValue": "3"
              }
            },
            {
              "key": "SyslogFacility",
              "value": {
                "stringValue": "DAEMON"
              }
            },
            {
              "key": "SyslogSeverityValue",
              "value": {
                "intValue": "6"
              }
            },
            {
              "key": "SyslogSeverity",
              "value": {
                "stringValue": "INFO"
              }
            },
            {
              "key": "SeverityValue",
              "value": {
                "intValue": "2"
              }
            },
            {
              "key": "Severity",
              "value": {
                "stringValue": "INFO"
              }
            },
            {
              "key": "EventTime",
              "value": {
                "intValue": "1769159427000000000"
              }
            },
            {
              "key": "ProcessID",
              "value": {
                "intValue": "26459"
              }
            }
          ]
        }
      }
    },
    {
      "key": "SeverityNumber",
      "value": {
        "intValue": "9"
      }
    },
    {
      "key": "body",
      "value": {
        "stringValue": "Accepted publickey for john from 192.168.1.1 port 41193 ssh2"
      }
    },
    {
      "key": "resource",
      "value": {
        "kvlistValue": {
          "values": [
            {
              "key": "Attributes",
              "value": {
                "kvlistValue": {
                  "values": [
                    {
                      "key": "SourceName",
                      "value": {
                        "stringValue": "sshd"
                      }
                    },
                    {
                      "key": "SourceModuleName",
                      "value": {
                        "stringValue": "sp_in_syslog_tcp"
                      }
                    },
                    {
                      "key": "SourceModuleType",
                      "value": {
                        "stringValue": "im_tcp"
                      }
                    },
                    {
                      "key": "Hostname",
                      "value": {
                        "stringValue": "SRV01"
                      }
                    }
                  ]
                }
              }
            }
          ]
        }
      }
    },
    {
      "key": "SyslogFacilityValue",
      "value": {
        "intValue": "1"
      }
    },
    {
      "key": "SyslogFacility",
      "value": {
        "stringValue": "USER"
      }
    },
    {
      "key": "SyslogSeverityValue",
      "value": {
        "intValue": "5"
      }
    },
    {
      "key": "SyslogSeverity",
      "value": {
        "stringValue": "NOTICE"
      }
    },
    {
      "key": "SeverityValue",
      "value": {
        "intValue": "2"
      }
    }
  ],
  "droppedAttributesCount": 0,
  "flags": 0,
  "traceId": "",
  "spanId": ""
}
With NXLog Platform’s OpenTelemetry templates, the outcome is immediate. Your logs become usable in observability workflows with minimal effort. And if your applications use a different log format, you can set up your own configurations to transform them into OpenTelemetry.
The result is telemetry that is consistent across legacy applications and modern systems, making correlation and analysis easier.
Conclusion
Adopting OpenTelemetry does not have to start with rewriting applications. For organizations depending on legacy applications and third-party systems, that approach is neither realistic nor necessary.
The data you need for observability already exists in your logs. Converting these logs to OpenTelemetry is the simplest and safest path, allowing you to improve observability without putting business-critical systems at risk.
NXLog Platform brings all these features together, giving you the tools to collect, parse, enrich, and convert application logs into OpenTelemetry. Since the transition happens outside the application, you can adopt OpenTelemetry at your own pace, building modern observability on top of your current systems instead of replacing them.
In this blog post, we showcased one practical path to adopting OpenTelemetry with NXLog Platform. To see how flexible this approach can be in different environments, watch our demo video on converting and forwarding syslog data as OpenTelemetry to your preferred observability or analytics backend.