
Ever tried to analyze IIS logs manually across dozens of web servers during a security incident? If so, you know the challenge: massive log files across multiple systems, cryptic log entries, and no easy way to correlate events. When running Microsoft Internet Information Services (IIS) across large infrastructures, log data accumulates quickly, increasing the risk of missing critical events.
IIS log analysis software is designed to collect, parse, and analyze IIS web server logs to monitor activity, troubleshoot performance issues, detect threats, and demonstrate compliance.
A dedicated enterprise IIS log analyzer goes far beyond what a basic log viewer can do. Enterprise-grade tools centralize log data from your entire IIS infrastructure, normalize it into a queryable format, and surface actionable insights through dashboards, alerts, and reports.
In this article, we’ll review leading enterprise IIS log analysis tools available today, comparing established SIEM platforms with cloud-native and open-source alternatives. We’ll also explore how NXLog Agent fits into the picture as the collection layer that ensures your chosen analysis platform receives clean, structured IIS data.
What are IIS logs and what do they contain?
IIS logs are records of HTTP activity generated by Microsoft Internet Information Services that capture details of every request made to a web server, including the client IP address, requested resource, HTTP status code, response size, and processing time.
By default, IIS writes logs in the W3C Extended Log Format to C:\inetpub\logs\LogFiles\, organized into subdirectories per site (for example, W3SVC1 for the first site), with a new file created each day.
While this structure is manageable on a single server, it leads to fragmented log data across large environments.
The fields recorded in each log entry depend on your IIS configuration. The most common ones are:
| Field | Description |
|---|---|
|
Timestamp of the request (UTC) |
|
Client IP address |
|
HTTP method ( |
|
Path of the requested resource |
|
Query string, if present |
|
HTTP status code returned by the server |
|
Bytes sent to the client / received from the client |
|
Time in milliseconds to process the request |
|
Client user agent string |
Enterprise IIS log analysis software parses and indexes these fields to answer questions like:
-
Which endpoints are slowest?
-
Which IP addresses are generating anomalous traffic?
-
Which requests are failing?
Why IIS log analysis matters at enterprise scale
Analyzing IIS log files across large infrastructures provides visibility into performance, security, and compliance. Failing to do so can result in downtime, security breaches, and regulatory penalties.
The four core use cases driving IIS log analysis at enterprise scale are:
- Web server performance monitoring
-
IIS logs record the
time-takenfield for each request, making them a direct source of web server performance data. By analyzing this field alongsidesc-statusandcs-uri-stem, you can identify which pages are slowest, which endpoints are throwing errors, and whether performance issues are isolated to a specific server or systemic across the infrastructure. Without log analysis, slow pages and server errors surface only when users report them, often long after the damage is done. - Security auditing
-
IIS logs capture every inbound request, making them essential for security auditing. Patterns such as repeated
401or403responses against a single resource, high request rates from a single IP, or unusual spikes incs-uri-querylength are indicators of attacks, including credential brute-forcing, DDoS attempts, and injection probing. At enterprise scale, these signals reside among millions of log lines. Detecting them requires automated analysis, not manual log review. - Troubleshooting application and configuration issues
-
When an application error occurs, IIS logs are usually the fastest path to determine the cause. The combination of
sc-status,cs-uri-stem, andtime-takencan distinguish between an application-level failure, a timeout, a misconfiguration, and a broken upstream dependency. This allows you to diagnose issues proactively, rather than relying on user reports or deploying additional instrumentation after the fact. - Compliance and forensic investigation
-
Many regulatory frameworks, including PCI-DSS, HIPAA, and ISO 27001, require organizations to retain web server access logs and demonstrate the ability to reconstruct events after an incident. IIS logs provide the audit trail that satisfies these requirements, recording who accessed what, when, and from where. In an investigation, that same trail allows your security team to reconstruct the sequence of events, determine the scope of exposure, and establish a remediation timeline.
These use cases demonstrate that analyzing IIS logs at enterprise scale cannot be done with a basic log reader; it requires software designed to handle the volume, correlate events across sources, and automatically surface the right signals.
Key features to look for in enterprise IIS log analysis software
Not all log analysis tools are suitable for enterprise workloads. When looking for an IIS log analyzer tool, the following capabilities distinguish solutions that can scale with your infrastructure.
- Centralized log collection
-
Enterprise environments often run IIS across many servers and sites, making centralized log aggregation essential. Some platforms require agents on each server to forward logs in real time, while others accept logs via syslog, HTTP endpoints, or direct cloud storage integration. Each model has trade-offs in network overhead, operational complexity, and reliability. The best choice depends on your infrastructure.
- Parsing and normalization
-
IIS logs are space-delimited W3C text files with varying fields across deployments. An enterprise-grade log parser should automatically extract all available fields, normalize them into a consistent schema, and make them searchable. This normalization supports reliable cross-server correlation and reporting.
- Advanced search and filtering
-
The value of log data depends on how fast you can query it. Enterprise IIS log analysis tools index data to allow searches across billions of records in seconds. Support for structured query languages and saved searches is also a necessity for running daily investigations.
- Real-time monitoring and alerting
-
Delaying log review until after an incident means the window to respond has already closed. An effective IIS log analyzer should support real-time analysis of incoming log data and trigger alerts when thresholds are met. Routing alerts to ticketing systems, email, or SIEM platforms is standard at enterprise scale.
- Visualization and reporting
-
Raw log data is not useful to everyone. Dashboards showing traffic trends, error rates, response times, and the most requested resources provide a shared view of IIS health. Scheduled reports that translate this data into executive summaries cover the compliance and governance side.
- Security analytics
-
Enterprise logging vendors are increasingly embedding threat detection capabilities into their platforms. Built-in detection for common web attacks, such as SQL injection attempts, XSS probing, directory traversal, and DDoS signatures, reduces the time from log ingestion to actionable security signals. Integration with SIEM correlation rules is important if security monitoring is a primary use case.
- Scalability and retention
-
Enterprise IIS environments can generate tens of thousands of log events per second across different sites and servers. The platform must ingest the events at this rate without data loss, compress and store logs cost-effectively, and maintain performance as your infrastructure grows. Cloud-native tools handle scaling automatically, while on-premises solutions should support distributed, clustered architectures.
- Ease of use
-
Platforms that require specialist training create a bottleneck, limiting who can operate them. The best tools provide both a GUI for browsing and filtering IIS logs and a robust query language for advanced users. API access for automation and integration with existing workflows is also ideal.
- Integration with external log shippers and sources
-
IIS logs rarely tell the full story on their own. In enterprise environments, you typically need to correlate IIS access logs with Windows events, application logs, firewall data, and other sources to investigate incidents accurately. A tool that accepts logs from external log shippers, such as NXLog Agent, and supports heterogeneous source types provides a complete view without vendor lock-in.
In the next section, we’ll look at tools that vary significantly in how well they address these capabilities.
Top enterprise IIS log analysis tools
Dozens of enterprise log analysis tools exist, each with different strengths, pricing models, and deployment requirements. The tools we highlight below span established SIEM platforms, cloud-native observability tools, and open-source stacks. We chose these tools because they are widely deployed in environments where IIS log analysis is a serious operational requirement.
Our goal is to provide a clear picture of what each tool does well, its limitations, and how it handles the IIS-specific challenges covered in the previous sections.
Splunk Enterprise
Splunk Enterprise is a widely used SIEM in enterprise environments. It collects IIS logs via the Splunk Universal Forwarder, and the Splunk Add-on for Microsoft IIS provides pre-built W3C field extractions, mapping fields into Splunk’s Common Information Model so they are immediately usable in dashboards and correlation rules.
Once indexed, data is queried using SPL (Search Processing Language), which supports complex queries across billions of records. Combining IIS logs with Active Directory or firewall data in a single query is straightforward, making Splunk particularly effective for reconstructing attack chains. Distributed indexer clusters scale horizontally to handle high log volumes, and a large app ecosystem on Splunkbase offers a wide range of integrations.
The primary consideration is cost, as Splunk licenses are based on data ingestion volume, which adds up quickly in high-volume environments. For enterprises with the budget, Splunk remains one of the most capable and mature options available.
SolarWinds Security Event Manager
SolarWinds Security Event Manager (SEM) is an on-premises SIEM focused on security monitoring and compliance. It collects IIS logs via lightweight agents and normalizes incoming log data into a unified schema, so IIS fields are consistently structured alongside logs from other sources, such as Windows events, firewall data, and application logs, without manual parsing configuration. The built-in IIS log viewer and reader provide immediate visibility into web server activity from a single dashboard.
SEM’s main strength for IIS environments is real-time security analysis. Its correlation engine uses built-in detection rules to flag patterns indicating web attacks, such as SQL injection, directory traversal, and credential brute-forcing. Alerts can trigger automated responses, such as blocking an IP address or raising a ticket, without waiting for human review. For forensic investigation, SEM stores logs in compressed format for long-term retention and provides pre-built compliance reports for PCI-DSS, HIPAA, and SOX, reducing the manual effort required for audit preparation.
SEM is best suited to security-focused teams that need a self-contained on-premises SIEM with built-in IIS support. While less flexible than Splunk for ad hoc queries, its simpler licensing and security-focused features make it practical for mid-market enterprises or for regulated environments that require on-premises log retention.
ManageEngine EventLog Analyzer
ManageEngine EventLog Analyzer is an IT compliance and log management tool focused on auditing and reporting for Microsoft server environments. It supports both agent-based and agentless IIS log collection, all common IIS log formats, and requires minimal configuration to start IIS log analysis.
EventLog Analyzer stands out for its pre-built, comprehensive IIS reporting. Out of the box, it provides dedicated reports for HTTP error trends, authentication failures, and security threats with real-time alerting when thresholds are crossed. On the operational side, usage analytics reports highlight top visitors, most-requested pages, and traffic trends over time, which are useful for capacity planning and anomaly detection. The platform also covers IIS FTP logs, making it one of the few tools that gives visibility into file transfers alongside web requests. The log viewer is straightforward enough for administrators who are not dedicated security analysts, with raw log search available when needed.
EventLog Analyzer is best-suited for compliance officers and system administrators who need reliable audit trails and reports without investing in a full SIEM. It trades some of the query flexibility of platforms like Splunk for significantly lower operational overhead, making it ideal for teams that need to regularly audit IIS logs but lack dedicated security engineering resources.
Sumo Logic
Sumo Logic is a cloud-native log management and analytics SaaS platform. It collects IIS logs via a lightweight agent or HTTP endpoints, and the Sumo Logic IIS Log Analyzer App provides pre-built dashboards that surface request rates, error rates, top pages, client geolocation, and traffic trends.
Sumo Logic stands out for its machine learning capabilities. Its anomaly detection engine monitors IIS log patterns and flags deviations from baseline behavior, such as spikes in error rates, unexpected traffic volumes, or shifts in user agent distributions, without requiring predefined threshold rules. This helps identify performance and security anomalies that might otherwise go unnoticed. It supports all log types, allowing IIS data to be correlated with the broader environment without managing separate pipelines.
Sumo Logic is best-suited for DevOps and SecOps teams seeking cloud-managed infrastructure and immediate insights. The SaaS model scales automatically with log volume, benefiting organizations with distributed IIS environments. Pricing is consumption-based, so costs increase with data volume, a factor worth modeling before committing.
Datadog Log Management
Datadog Log Management is part of a broader observability platform that combines infrastructure metrics, APM traces, and log data in a single interface. IIS logs are collected via the Datadog Agent, which auto-detects IIS log files and applies built-in parsing pipelines to extract W3C fields without manual configuration. For organizations already using Datadog for infrastructure or application monitoring, extending it to IIS log management requires minimal additional setup.
Datadog’s main advantage for IIS environments is cross-signal correlation.
Spikes in 500 errors can be viewed alongside CPU utilization, memory pressure, and application traces in the same timeline, making it easier to determine the cause of web server errors.
Live Tail allows real-time streaming of IIS log entries with faceted filtering, and threshold-based alerts can trigger on log patterns or derived metrics, such as sustained increases in 404 responses.
Datadog also offers Security Monitoring, which applies detection rules to log streams for basic threat detection using the same IIS data.
Datadog is best suited for enterprises that already use it as their observability platform and want to avoid managing a separate log analysis tool. Using Datadog solely for IIS log analysis, without the surrounding metrics and trace context, may not justify the cost compared to dedicated log management tools. Log retention is tiered by plan, so it is important to validate your retention requirements against the pricing model before deployment.
Elastic Stack (ELK) and open source options
For organizations with in-house engineering capacity, open-source platforms can deliver enterprise-grade IIS log analysis without the cost of commercial licensing. The most widely deployed options are Elastic Stack and Graylog.
The Elastic Stack (Elasticsearch, Logstash, Kibana, also known as ELK) is the most common open source IIS log analyzer setup. Filebeat or Logstash collects IIS log files from each server, applies Grok patterns to parse W3C fields, and ships structured data into Elasticsearch for indexing. Kibana provides dashboards and ad hoc search over the indexed data, and the Elastic Common Schema (ECS) ensures IIS fields map consistently alongside logs from other sources. Elastic Cloud offers a managed version for teams that want the ELK capabilities without operating the cluster themselves, with commercial features, including security analytics and alerting, available under paid tiers.
Graylog is an open source log management platform with a built-in web interface, structured search, and pipeline-based parsing. It can ingest IIS logs via the Graylog Sidecar agent or via syslog inputs, with processing pipelines that extract and normalize W3C fields. It serves as a lightweight alternative to a full SIEM, supporting centralized log management and search without the operational complexity of a full ELK deployment. A commercial Graylog Enterprise edition adds features such as archiving, audit logging, and extended support.
Both options involve operational overhead. Configuration, index management, scaling, and upgrades require dedicated engineering time. Open source works well when an internal team can own the platform, but in resource-constrained environments, the total cost of ownership often approaches that of a commercial solution.
How NXLog Agent enhances your IIS log analysis pipeline
None of the tools described above collects IIS logs independently; an agent must run on the web server. NXLog Agent is designed to fill that role across any environment, whether Windows or Linux, on-premises or in the cloud. It serves as the collection and normalization layer between your IIS servers and your chosen analysis platform.
- Collecting and parsing IIS logs
-
NXLog Agent reads IIS log files in real time using the File input module, which tails log files as new entries are written. For W3C Extended Log Format files, the W3C extension provides native parsing, mapping each field to a named, typed variable. As a result, IIS log data arrives at the analysis platform already structured, with fields such as
sc-status,cs-uri-stem,time-taken, andc-ipavailable as discrete values instead of raw log strings.For environments where IIS is configured to log via Event Tracing for Windows (ETW), NXLog Agent provides the Event Tracing for Windows input module, which reads tracing data directly from the ETW subsystem at the source, before it reaches the file system. See our Microsoft IIS integration guide for configuration details on both approaches.
- Normalization, enrichment, and filtering
-
Before forwarding, NXLog Agent can enrich log events with additional context, such as tagging events with the source server hostname, environment, or site name. This ensures logs from multiple IIS servers arrive at the analysis platform already attributed. Fields can be renamed, values transformed, and unnecessary fields removed at the source. Filtering noise before it reaches the analysis platform reduces data volume and, for tools licensed by ingestion volume, lowers the cost.
- Flexible, reliable forwarding
-
NXLog Agent supports forwarding to any destination, including the tools we covered in this article, with output formatted as syslog, JSON, CEF, or the required format. It can also forward data to multiple destinations simultaneously, which is useful when IIS logs must be sent to both a SIEM for security analysis and another platform for operational monitoring. All transmissions can be secured with TLS, and built-in buffering ensures log events are not lost if a downstream destination is temporarily unavailable.
This combination of structured collection, source-side processing, and reliable multi-destination forwarding is why NXLog Agent is commonly deployed as the first stage of enterprise IIS log pipelines, regardless of the analysis platform that sits downstream.
The configuration below illustrates this pipeline: NXLog Agent tails IIS log files, parses W3C fields with the dedicated W3C extension, enriches each event with a site identifier, and forwards the records to an OpenTelemetry-compatible SIEM over OTLP/HTTPS.
<Extension w3c_parser>
    Module              xm_w3c
</Extension>

<Input iis_logs>
    Module              im_file
    File                'C:\inetpub\logs\LogFiles\W3SVC*\ex*.log'
    InputType           w3c_parser
    <Exec>
        $RecordType = 'Log';          (1)
        $site       = 'web-prod-01';  (2)
        if ($sc-status >= 500) {
            $Severity = 'ERROR';      (3)
        }
    </Exec>
</Input>

<Output siem_otlp>
    Module              om_otel
    URL                 https://siem.example.com:4318/ (4)
    Format              json
    HTTPSCAFile         %CERTDIR%/siem-ca.pem          (5)
    HTTPSCertFile       %CERTDIR%/agent-cert.pem
    HTTPSCertKeyFile    %CERTDIR%/agent-key.pem
</Output>

<Route iis_to_siem>
    Path                iis_logs => siem_otlp
</Route>| 1 | Tags the record as a log signal so the OpenTelemetry Exporter output module instance routes it to the OTLP logs endpoint. |
| 2 | Adds a source-side site identifier so events from multiple IIS servers arrive at the SIEM already attributed. |
| 3 | Promotes 5xx responses to ERROR severity, making server failures easy to filter downstream. |
| 4 | Standard OTLP/HTTP receiver endpoint of the downstream SIEM. |
| 5 | Mutual TLS for transport security: the agent verifies the SIEM with CAFile and authenticates itself with the client certificate and key. |
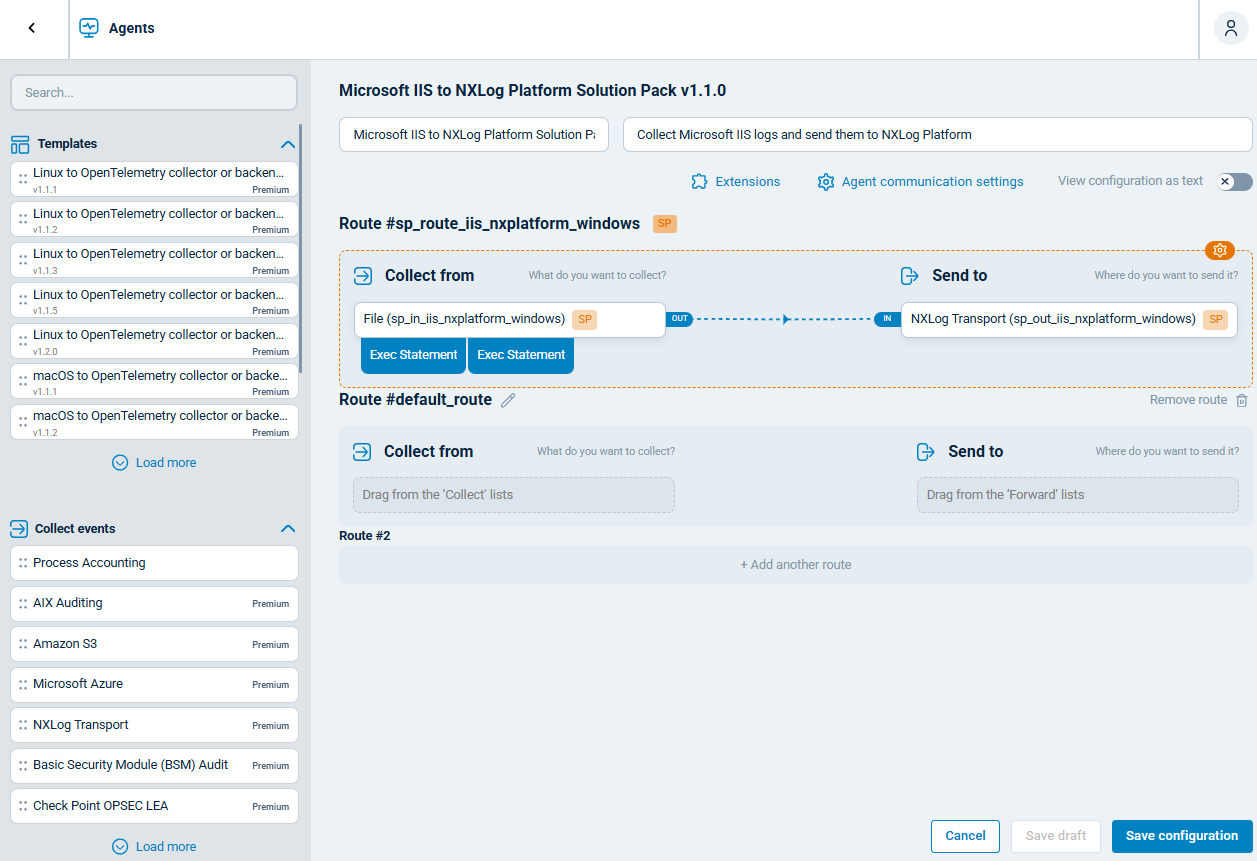
Alternatively, you can use NXLog Platform’s IIS configuration templates to set up the pipeline using a drag-and-drop interface.
Conclusion
The right enterprise IIS log analysis software depends on your organization’s priorities: whether that is security, compliance, scalability, or operational simplicity. Budget, existing tooling, and regulatory requirements all shape which platform fits best, and the tools we covered represent the range of options available across deployment models and price points.
Every platform depends on the quality of the data it receives. Pairing your chosen analysis tool with NXLog Agent as the collection layer ensures IIS logs arrive structured, enriched, and complete from the moment they leave your web servers. If you are assessing your current log pipeline, that is the right place to start: a well-built collection stage makes every downstream tool more effective, and keeps your web infrastructure secure, compliant, and performing at its best.
FAQ
- What IIS log format should I use?
-
IIS supports several log formats, including W3C Extended, NCSA Common, IIS native, and custom, but W3C is the right choice for almost all enterprise deployments. It is the default format, supports the widest range of configurable fields, and is what every log analysis tool and parser covered in this article expects. NCSA and native IIS formats capture a fixed, narrower set of fields and are rarely used in practice. Unless you have a specific requirement that W3C cannot meet, there is no reason to change it.
- How can I analyze IIS log files in real time?
-
Real-time IIS log analysis requires a log collector agent on each IIS server forwarding log events to a platform that supports live ingestion and indexing, such as Splunk, SolarWinds SEM, Sumo Logic, or Datadog. With that pipeline in place, you get real-time dashboards, threshold-based alerts, and the ability to search incoming log data as it arrives.
- Does Microsoft have an IIS log analysis tool?
-
Microsoft offers Log Parser 2.2 (and Log Parser Studio as a GUI), which runs SQL-like queries against IIS log files, and Azure Monitor and Microsoft Sentinel for broader log collection and alerting in the cloud. Both options have significant limitations: Log Parser requires manual query writing with no real-time capabilities, while Azure Monitor and Sentinel are broad SIEMs that introduce cloud dependencies and costs. Most enterprise teams supplement or replace them with dedicated IIS log analysis tools for better usability and more targeted features.
- What is the best way to centralize IIS logs from multiple servers?
-
Deploy a log collector agent, such as NXLog Agent, on each IIS server to tail log files and forward events to a central log management platform or SIEM, which can be self-hosted (Splunk, Graylog, Elastic Stack) or cloud-based (Sumo Logic, Datadog). Centralizing logs this way enables cross-server search, unified reporting, and consistent retention, while keeping logs secure on a system outside the web servers themselves.