
OpenTelemetry provides a common instrumentation model that makes it easier to collect telemetry data across distributed systems, and many modern applications are adopting it as a standard for generating logs and metrics. However, in practice, you still need to collect, process, and shape the data before it becomes useful. You cannot simply forward raw telemetry data downstream without risking that your observability platform becomes expensive storage instead of a means of maintaining visibility into your environment.
We designed NXLog Platform to provide a vendor-neutral layer that can collect logs and metrics, process them, and forward clean, normalized data to downstream systems. This approach separates instrumentation from data handling, allowing you to standardize and improve the quality of telemetry data without modifying applications.
In this article, we look at how to build a practical OpenTelemetry pipeline with NXLog Platform and NXLog Agent, focusing on collecting logs and metrics, processing, and forwarding them at scale.
Collecting OpenTelemetry logs and metrics
The first step to collecting OpenTelemetry data from your applications is establishing a reliable ingestion point. OpenTelemetry commonly uses the OpenTelemetry Protocol (OTLP) over HTTP or gRPC, allowing logs and metrics to be delivered using a standardized format. This standardization removes the need for format-specific collectors and makes it possible to collect telemetry data from different services uniformly.
Logs and metrics generated by the same service or application typically share common resource attributes, such as the service name, environment, and host information. Ideally, you handle these different signal types within the same collection layer to ensure that processing logic is applied consistently across your data. This approach also reduces operational complexity by avoiding multiple collection paths.
When collecting telemetry data, you must account for unpredictable traffic patterns. Metrics are usually emitted at regular intervals and can generate high volumes of data. On the other hand, logs may be generated in bursts during a failure or peak activity. The collection layer must reliably handle these fluctuations without losing data.
Processing OpenTelemetry logs and metrics
After collecting the telemetry data, the next step is to process it before forwarding it downstream. Raw OpenTelemetry data often contains more details than required for day-to-day observability. Debug logs, low-value metrics, and verbose attributes can quickly increase storage and query costs without improving visibility. At this stage, you’ll want to filter out unnecessary data and ensure that only relevant telemetry reaches downstream systems.
Processing also provides an opportunity to normalize and enrich your telemetry data across heterogeneous sources. Applications that produce OpenTelemetry data do not necessarily follow the same instrumentation practices and may differ in naming conventions and included metadata, making correlation later on difficult. Normalizing and enriching your data creates a standardized data structure, simplifying querying and analysis across services and applications.
A key advantage of processing telemetry close to the source is that it happens once. Instead of each downstream system applying its own processing logic, you apply it centrally, producing consistent telemetry data that can be forwarded to any backend.
This processing layer also plays an imoprtant role in maintaining a reliable pipeline. Data spikes can introduce backpressure if the downstream system cannot keep up. The tool you choose to process your OpenTelemetry data must manage these conditions through buffering, flow control, and reliable delivery mechanisms. These measures allow data collection and processing to continue without data loss.
Forwarding processed telemetry data
Once telemetry data is collected and processed, the final step in the pipeline is forwarding it to downstream systems in the format they expect. NXLog Platform treats logs and metrics as first-class outputs, allowing both signal types to be forwarded via dedicated output modules to different backends. To simplify the implementation, NXLog Platform provides a set of OpenTelemetry configuration templates. These templates define ready-to-use pipelines for common destinations, including Azure Sentinel, Google Security Operations, Splunk, and NXLog Platform.
Apart from these templates, NXLog Agent provides a long list of output modules, including ones commonly used to export metrics, such as the Elasticsearch, OpenTelemetry Exporter, and Prometheus modules.
Because processing takes place before forwarding, destinations remain interchangeable. With NXLog Agent, you can forward the same telemetry data to different backends or route different signal types to different backends. This flexibility allows you to evolve your observability stack without introducing new tools over time.
From an OpenTelemetry source to backend: an example pipeline
For this example, we use a simple JavaScript application that processes incoming web requests. The application is instrumented with OpenTelemetry and emits the following telemetry data for each request it handles:
-
A log record, with the latency included as an attribute.
-
A metric that maintains a running counter of total processed requests, with the current response status included as an attribute.
We will then forward the log records to NXLog Platform and expose the metrics in a Prometheus-compatible format via an HTTP endpoint.
This setup provides a straightforward but realistic example of how logs and metrics from the same application or service can be collected, processed, and forwarded through a telemetry pipeline.
OpenTelemetry data generated by the application
The first example below shows an OpenTelemetry log record generated by our demo application when it processed a web request. Each record contains structured fields describing the request and contextual attributes attached by the OpenTelemetry instrumentation.
{
  "resourceLogs": [
    {
      "resource": { (1)
        "attributes": [
          {
            "key": "service.name",
            "value": {
              "stringValue": "demo-webapp"
            }
          },
          {
            "key": "service.version",
            "value": {
              "stringValue": "1.0.0"
            }
          },
          {
            "key": "deployment.environment",
            "value": {
              "stringValue": "staging"
            }
          }
        ],
        "droppedAttributesCount": 0
      },
      "scopeLogs": [
        {
          "scope": {
            "name": "webapp.logger"
          },
          "logRecords": [ (2)
            {
              "timeUnixNano": "1770369689435000000",
              "observedTimeUnixNano": "1770369689435000000",
              "severityText": "INFO",
              "body": {
                "stringValue": "Processed request"
              },
              "attributes": [
                {
                  "key": "latency_ms",
                  "value": {
                    "intValue": 37
                  }
                },
                {
                  "key": "status",
                  "value": {
                    "stringValue": "success"
                  }
                }
              ],
              "droppedAttributesCount": 0
            }
          ]
        }
      ]
    }
  ]
}| 1 | Shared resource attributes describing the application. |
| 2 | The log records generated by the application. |
The next example is a metric record representing the total number of processed web requests. The metric is implemented as a counter and includes the response status as an attribute.
{
  "resourceMetrics": [
    {
      "resource": { (1)
        "attributes": [
          {
            "key": "host.name",
            "value": {
              "stringValue": "WEB-SRV"
            }
          },
          {
            "key": "host.arch",
            "value": {
              "stringValue": "amd64"
            }
          },
          {
            "key": "host.id",
            "value": {
              "stringValue": "7994bd4cc9744ab78846106097c30ff6"
            }
          },
          {
            "key": "process.pid",
            "value": {
              "intValue": 121652
            }
          },
          {
            "key": "process.executable.name",
            "value": {
              "stringValue": "node"
            }
          },
          {
            "key": "process.executable.path",
            "value": {
              "stringValue": "/opt/demo-webapp/.nvm/versions/node/v22.13.0/bin/node"
            }
          },
          {
            "key": "process.command_args",
            "value": {
              "arrayValue": {
                "values": [
                  {
                    "stringValue": "/opt/demo-webapp/.nvm/versions/node/v22.13.0/bin/node"
                  },
                  {
                    "stringValue": "/opt/demo-webapp/otel-node-demo/app.js"
                  }
                ]
              }
            }
          },
          {
            "key": "process.runtime.version",
            "value": {
              "stringValue": "22.13.0"
            }
          },
          {
            "key": "process.runtime.name",
            "value": {
              "stringValue": "nodejs"
            }
          },
          {
            "key": "process.runtime.description",
            "value": {
              "stringValue": "Node.js"
            }
          },
          {
            "key": "process.command",
            "value": {
              "stringValue": "/opt/webapp/otel-node-demo/app.js"
            }
          },
          {
            "key": "process.owner",
            "value": {
              "stringValue": "adm"
            }
          },
          {
            "key": "service.name",
            "value": {
              "stringValue": "demo-webapp"
            }
          },
          {
            "key": "service.version",
            "value": {
              "stringValue": "1.0.0"
            }
          },
          {
            "key": "deployment.environment",
            "value": {
              "stringValue": "staging"
            }
          }
        ],
        "droppedAttributesCount": 0
      },
      "scopeMetrics": [
        {
          "scope": {
            "name": "webapp.metrics",
            "version": ""
          },
          "metrics": [ (2)
            {
              "name": "web_requests_total",
              "description": "",
              "unit": "",
              "sum": {
                "aggregationTemporality": 2,
                "isMonotonic": true,
                "dataPoints": [
                  {
                    "attributes": [
                      {
                        "key": "status",
                        "value": {
                          "stringValue": "success"
                        }
                      }
                    ],
                    "startTimeUnixNano": "1770633595762000000",
                    "timeUnixNano": "1770633605482000000",
                    "asDouble": 26
                  }
                ]
              }
            }
          ]
        }
      ]
    }
  ]
}| 1 | Shared resource attributes describing the application. |
| 2 | The metrics generated by the application. |
NXLog Agent pipeline configuration
This NXLog Agent configuration implements the pipeline described above by collecting OpenTelemetry data over OTLP, applying processing logic, and forwarding logs and metrics to their respective outputs.
<Input otel>
    Module            im_otel
    ListenAddrHTTP    0.0.0.0:4318
    <Exec>
        if ($RecordType == "Metric") { (1)
            reroute("rt_metrics");
        }
    </Exec>
</Input>

<Output nxlog_platform>
    Module            om_batchcompress
    Host              relay.example.com:5514
    CAFile            %CERTDIR%/agent-ca.pem
    CertFile          %CERTDIR%/agent-cert.pem
    CertKeyFile       %CERTDIR%/agent-key.pem
    UseSSL            TRUE

    <Exec>
        if ($Severity == "DEBUG") { (2)
            drop();
        }
    </Exec>
</Output>

<Extension rewrite>
    Module            xm_rewrite
    Keep              web_requests_total, status, version, service_name, environment
</Extension>

<Input null>
    Module            im_null
</Input>

<Output prometheus>
    Module            om_prometheus
    ListenAddr        0.0.0.0:9400
    MappingFile       /opt/nxlog/etc/prometheus_schema.json (3)
    <Exec>
        if ($Name == "web_requests_total") { (4)
          $status = $DataPoints[0]('Attributes')('status');
          $web_requests_total = $DataPoints[0]('Value');

          $version = $Resource.Attributes('service.version');
          $service_name = $Resource.Attributes('service.name');
          $environment = $Resource.Attributes('deployment.environment');

          rewrite->process();
        }
        else {
            drop();
        }
    </Exec>
</Output>

<Route rt_logs> (5)
    Path              otel => nxlog_platform
</Route>

<Route rt_metrics> (6)
    Path              null => prometheus
</Route>| 1 | Reroutes metrics to be processed by the Prometheus output instance. |
| 2 | Discards debug log records. |
| 3 | The path to the Prometheus schema file. |
| 4 | Processes the record to convert it to the structure required by the Prometheus schema. |
| 5 | Sends OpenTelemetry logs to NXLog Platform. |
| 6 | Exposes Prometheus metrics via an HTTP endpoint. |
We used the following schema to expose Prometheus-compatible metrics:
{
  "metrics": {
    "counter": [
      {
        "name": "web_requests_total",
        "labels": ["status", "version", "service_name", "environment"]
      }
    ]
  }
}
This configuration demonstrates how a single NXLog Agent pipeline can handle multiple telemetry signals, keeping all the collection, processing, and forwarding logic centralized.
Telemetry at the destination
Once NXLog Agent processes and forwards the telemetry data, it immediately becomes available in its respective destination.
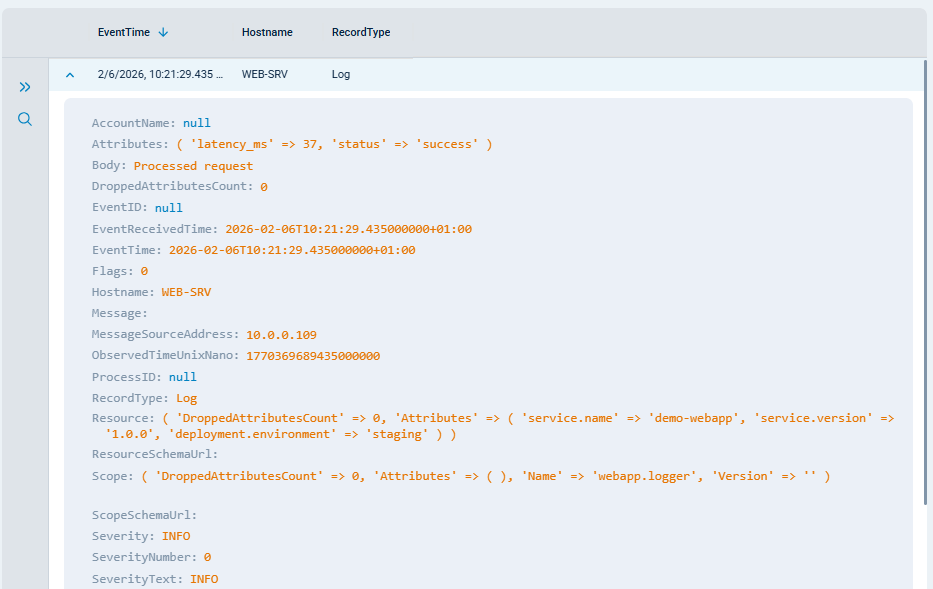
Log records appear in NXLog Platform as structured events, preserving the context and attributes generated by the application OpenTelemetry instrumentation while benefiting from the normalization applied by NXLog Agent.
Metric records are exposed via a Prometheus-compatible endpoint, where the data can be queried and visualized using standard Prometheus tooling. Accessing the endpoint returns the following response:
# TYPE web_requests_total counter
web_requests_total{service_name="demo-webapp",status="success",version="1.0.0",environment="staging"} 26
Conclusion
OpenTelemetry standardizes how telemetry data is generated, but building a reliable pipeline requires more than application instrumentation. Collecting, processing, and shaping telemetry before it reaches downstream systems ensures that your data remains useful and cost-effective. By introducing a dedicated processing layer, you can reduce noise, improve data quality, and maintain control over how telemetry flows through your infrastructure.
NXLog Platform provides this layer, allowing you to process your telemetry data through a single, vendor-neutral pipeline that can scale with your data. With this approach, you can streamline telemetry data from different vendors, standardizing it in a way that enables meaningful correlation across systems and environments.
In this blog post, we walked through a practical example of building an OpenTelemetry pipeline with NXLog Platform and NXLog Agent. To see how to configure a similar pipeline, watch our demo video on collecting and forwarding OpenTelemetry data using NXLog Platform.