
At NXLog, we help customers solve real-world telemetry data challenges and bring value to the table with NXLog Platform. One of the recurring problems we see is that while network event logs contain a wealth of information, turning them into actionable insights isn’t straightforward. Security operations teams often struggle to make sense of these logs in a way that directly supports threat detection, response, and investigation.
A perfect example of this challenge is VPN logs. VPNs are critical for secure remote work, yet the logs they generate are difficult to interpret without the right tools. That’s why, in this post, we’re going to show how you can use NXLog Agent to process OpenVPN logs and then leverage Elasticsearch and Kibana to visualize them, making your VPN telemetry immediately useful to SOC analysts and IT teams.
Why monitor VPN network logs?
VPNs have become critical infrastructure for remote work. They ensure the integrity of communications by encrypting traffic between employees and corporate resources. However, it’s important to remember that every VPN connection is effectively a gateway into your organization. Maintaining complete visibility into the health, security, and usage of those connections is critical to ensuring both operational stability and security.
Monitoring VPN logs has several benefits:
- Detect unusual VPN activity
-
Identify connections from unexpected locations, multiple failed authentication attempts, or bandwidth spikes that could point to malicious activity.
- Troubleshoot connectivity issues
-
Quickly spot why a user can’t connect, whether it’s an inactive session or a misconfigured client.
- Track session health
-
Ensure that VPN tunnels remain active and performing as expected, which is vital when supporting a remote workforce at scale.
- Feed SIEM and observability pipelines
-
Enrich monitoring platforms with VPN telemetry to strengthen both security detection and operational analytics.
By transforming VPN logs into structured telemetry data, they cease to be noise and become a source of intelligence that protects your business and ensures operational continuity.
OpenVPN status logs: What do they contain?
OpenVPN records session activity in a file called openvpn-status.log.
This log file captures information such as:
-
Client IPs and usernames — who is connected and from where.
-
Virtual IP addresses — the IPs assigned to connected clients.
-
Connection start times — when each session was initiated.
-
Bytes sent/received — measures the bandwidth usage per session.
For example, a log event may appear as follows:
CLIENT_LIST john.smith_LAPTOP 203.0.123.20:60000 172.27.232.11 580000 579800 2025-09-03 09:05:45 1756893666 john.smith 6 0 AES-256-GCMBreaking it down:
-
john.smith_LAPTOP— the Common Name from the client’s X.509 certificate -
203.0.123.20:60000— IP and port of the connecting client -
172.27.232.11— assigned VPN IP -
580000— total bytes received -
579800— total bytes sent -
2025-09-03 09:05:45— connection start timestamp -
1756893666— last activity timestamp -
john.smith— VPN username -
6— transport protocol, in this case TCP/IPv4 -
0— state flag, in this case, a normal session -
AES-256-GCM— data channel cipher used for encrypting VPN traffic
As you can see, this information is beneficial for network activity and security monitoring.
Collecting OpenVPN logs and sending them to Elasticsearch
NXLog Agent is a lightweight, cross-platform log collection agent that can parse raw OpenVPN status logs and convert them into structured telemetry data. Here is how we can approach this:
-
Use the File input module to collect the logs from
openvpn-status.log. -
Parse the log records using a regular expression.
-
Convert the records to JSON format.
Elasticsearch excels at storing and indexing time-series event data, making it perfect for network event logs. Getting data into Elasticsearch is easy with NXLog Agent, which provides a dedicated Elasticsearch output module and works with both on-premises and hosted Elasticsearch instances, such as Elastic Cloud.
Here is the complete configuration:
User                 root (1)

GenerateDateInUTC    TRUE (2)
ParseDateInUTC       TRUE

<Extension json>
    Module           xm_json
</Extension>

<Input openvpn_status>
    Module          im_file
    File            '/var/log/openvpn/openvpn-status.log'
    <Exec>
      if ($raw_event =~ /CLIENT_LIST\s+(\S+)\s+(\S+)\s+(\S+)\s+(\S*)\s+(\d+)\s+(\d+-\d+-\d+ \d+:\d+:\d+)\s+(\d+)\s+(\S+)\s+(\d+)\s+(\d+)+\s(\S+)/) {
          $cn_user = $1;
          $real_ip = $2;
          $virt_ip = $3;
          $bytes_recv = integer($4);
          $bytes_sent = integer($5);
          $connected_since = parsedate($6);
          $last_seen = parsedate($7);
          $username = $8;
          $proto_ver = $9;
          $flag = $10;
          $cipher = $11;
          $EventTime = now();
      } else {
          drop(); (3)
      }
      to_json();
    </Exec>
</Input>

<Output elasticsearch>
    Module          om_elasticsearch
    URL             http://172.19.113.201:9200/_bulk (4)
</Output>

<Route openvpn_to_elasticsearch>
    Path            openvpn_status => elasticsearch
</Route>| 1 | Grants NXLog Agent access to read log files in the /var/log/ directory. |
| 2 | Generates and expects dates in UTC. |
| 3 | Discards lines that do not match the regular expression. |
| 4 | Replace the IP address and port with your Elasticsearch instance details. |
Configuring an agent is easy with NXLog Platform. Find your agent, paste the configuration into the editor, and save your changes.
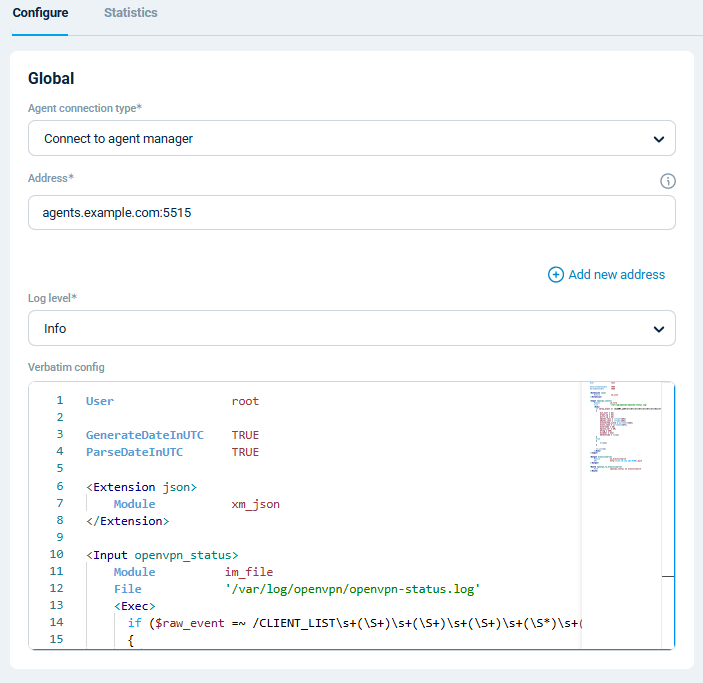
You can also create a configuration and assign it to multiple agents.
When NXLog Agent processes the OpenVPN status log event we analyzed above with this configuration, it will send the following record to Elasticsearch:
{
  "EventReceivedTime": "2025-09-03T13:43:50.791724+02:00",
  "SourceModuleName": "openvpn_status",
  "SourceModuleType": "im_file",
  "Hostname": "VPN-SRV",
  "cn_user": "john.smith_LAPTOP",
  "real_ip": "203.0.123.20:60000",
  "virt_ip": "172.27.232.11",
  "bytes_recv": 580000,
  "bytes_sent": 579800,
  "connected_since": "2025-09-03T11:05:45.000000+02:00",
  "last_seen": "2025-09-03T12:01:06.000000+02:00",
  "username": "john.smith",
  "proto_ver": "6",
  "flag": "0",
  "cipher": "AES-256-GCM",
  "EventTime": "2025-09-03T13:43:50.791724+02:00"
}
With this setup, OpenVPN logs flow straight into Elasticsearch, where you can query them in Kibana. Let’s dive into that next.
Visualizing VPN network telemetry in Kibana
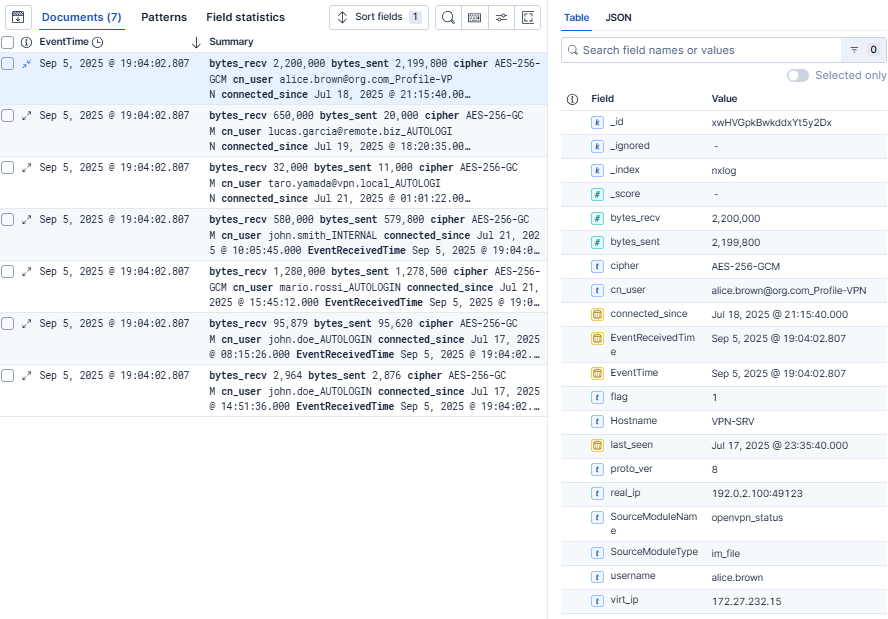
Once your OpenVPN logs are in Elasticsearch, you can immediately start exploring them in the Discover page, which lets you search and inspect the raw events in real time. This is already a big step up from scrolling through plain text log files.
However, the real value comes from turning events into insights with Kibana dashboards. Dashboards allow you to aggregate and visualize the telemetry data, making it easy to spot patterns, monitor activity, and identify potential issues at a glance. For example, you can build an OpenVPN dashboard with widgets such as:
-
Bytes sent/received per client to track bandwidth consumption and detect heavy usage.
-
Users connected to the VPN to see how many people are online at any moment.
-
Inactive users to identify stale connections that have timed out.
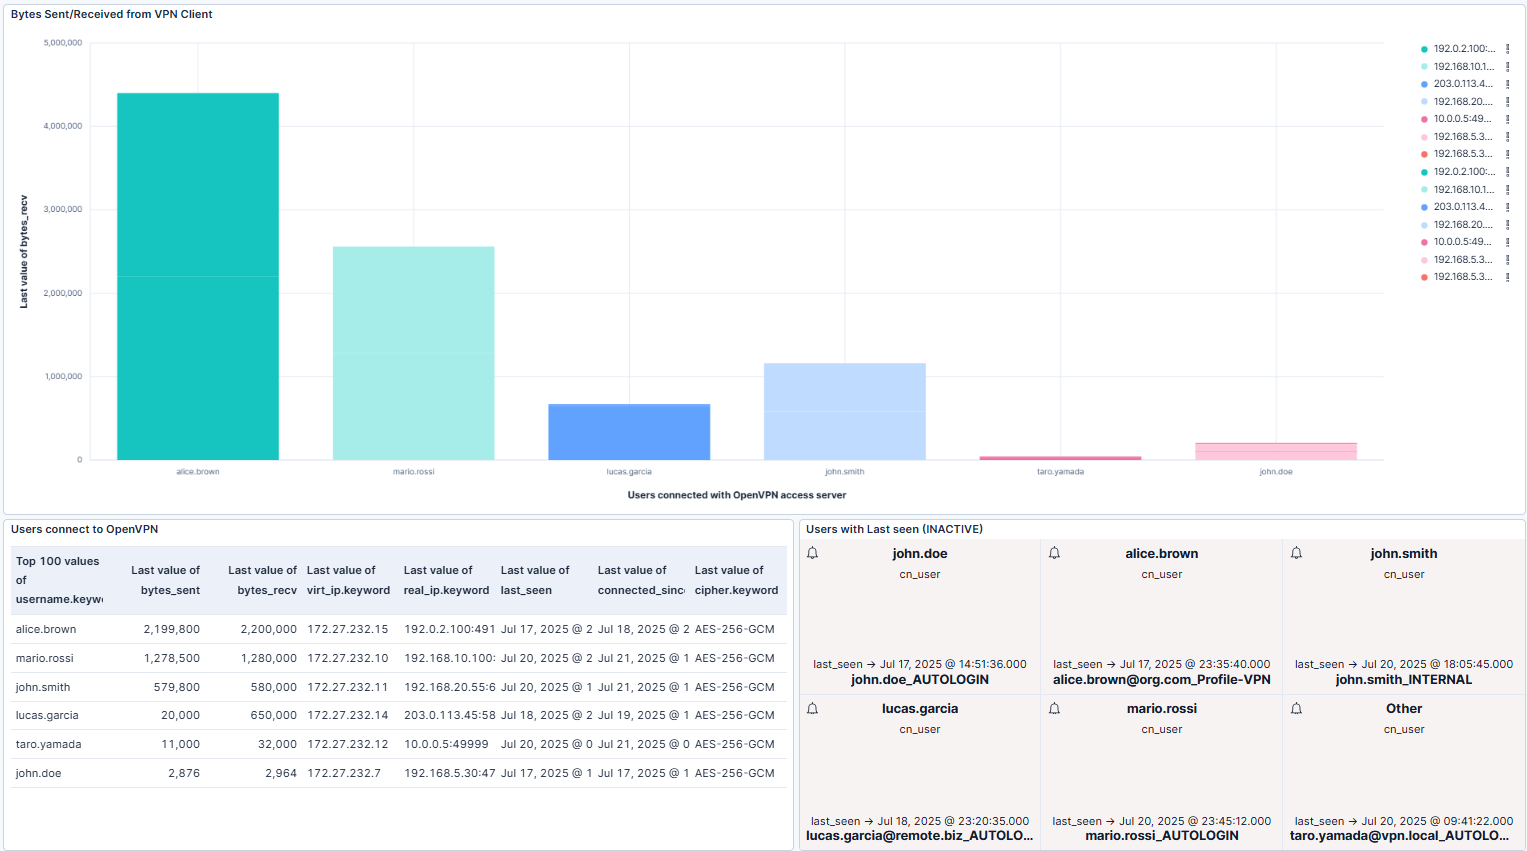
To help you get started, we’ve prepared a Kibana dashboard containing these widgets.
You can import it into Kibana by navigating to Stack Management and then clicking on Saved Objects under Kibana.
Then, click Import and upload the .ndjson file.
With these types of visualizations, you can transform raw log events into actionable insights that enhance security and operational visibility.
Conclusion
VPNs are too important to leave unmonitored. By collecting and parsing OpenVPN logs with NXLog Agent and visualizing them in Elasticsearch and Kibana, you can turn raw network events into actionable insights for security, troubleshooting, and performance monitoring.
Our mission is to help enterprises derive more value from their telemetry data and we’ve built NXLog Platform to help you unlock that potential. If you haven’t tried it yet, we encourage you to start with NXLog Agent and see how easily you can bring structure and meaning to your VPN logs.
This post is just the beginning. We’ll be publishing more guides on how to process and visualize logs from different technologies in the near future. We’d love to hear from you: what logs or platforms would you like us to cover next?