
As system and network administrators know, DNS logs are essential for understanding what’s happening across your infrastructure, whether you’re troubleshooting slow lookups, investigating odd traffic patterns, or monitoring your security posture.
We recently had the opportunity to help a customer set up monitoring for BIND9 logs and discovered that the two main options, syslog and dnstap, offer very different experiences in setup, performance, and the level of DNS visibility they provide.
After digging into the details and testing configurations, we found that there’s no one-size-fits-all solution. Syslog is familiar and integrates easily with existing pipelines, while dnstap requires more setup and configuration knowledge but delivers richer telemetry. In this blog post, we’ll share what we learned to help you understand the trade-offs and decide which approach best suits your environment.
BIND9 logging options
When it comes to monitoring BIND9 logs, you have two options: syslog and dnstap. Each method takes a different logging approach, and understanding these differences is key to choosing the right method for your environment.
- syslog
-
Syslog is the classic BIND9 logging method. It’s easy to activate and integrate with existing telemetry data pipelines. Because syslog is a common logging format, you’re probably already familiar with setting it up.
The trade-off is that syslog messages are unstructured, meaning they require custom regex parsing to extract information and lack details like the transport type and incomplete responses. Heavy syslog logging can also increase CPU and disk usage, which is something to consider if you’re dealing with high-volume DNS logging.
- dnstap
-
dnstap is a more recent alternative that provides structured DNS logging. This format produces a binary stream that includes detailed DNS query and response data, metadata, and fine-grained timestamps. You can convert the binary data to JSON using tools like dnstap-tools so that other systems in the pipeline, such as SIEMs and observability platforms, can ingest and process it.
Using the BIND9 dnstap format has clear benefits for getting full visibility into your DNS infrastructure. However, the downside is that it introduces dependencies on more tools, including
fstream,protobuf, anddnstap-tools, and has a larger storage footprint. It also requires additional setup and familiarity with the toolchain.
Side-by-side comparison: syslog vs. dnstap
The following table compares the two BIND9 logging options to see how they stack up side by side. This comparison highlights the key differences in setup, performance, and data format, so you can make an informed decision between the two.
| Feature | syslog | dnstap |
|---|---|---|
Setup complexity |
Easy to activate and works out of the box with existing telemetry pipelines. |
More complex to set up and requires |
Data structure |
Unstructured text that typically requires regex parsing. |
Structured binary that can be converted to JSON. It includes rich metadata. |
Query/response details |
Provides basic information and lacks transport details and the complete response. |
Contains the full context, including query/response, transport details, and metadata. |
Timestamps |
Standard syslog timestamps. |
Fine-grained timestamps for precise analysis. |
Performance impact |
Can add CPU and disk load when processing high volumes of DNS requests. |
Lower processing overhead in high-volume setups but has a larger storage footprint. |
Integration |
Works seamlessly with existing telemetry pipelines. |
Requires additional data conversion for other tools to ingest and process. |
Best for |
Small-to-medium environments that require quick setup and basic monitoring. |
Security-focused, high-volume DNS environments that need detailed analytics for monitoring and forensic investigations. |
Key takeaways:
-
syslog is familiar, quick to deploy, and works with standard logging infrastructure, but it provides limited, unstructured data.
-
dnstap provides detailed and structured telemetry, making it ideal for security monitoring and high-volume environments, but it requires additional setup and storage.
Choosing the right BIND9 logging approach
Once you understand how syslog and dnstap differ, the next step is deciding which option makes the most sense for your environment. The choice often comes down to how much detail you need from your DNS logs, how complex your setup can be, and what your existing telemetry pipeline supports.
When to choose BIND9 syslog
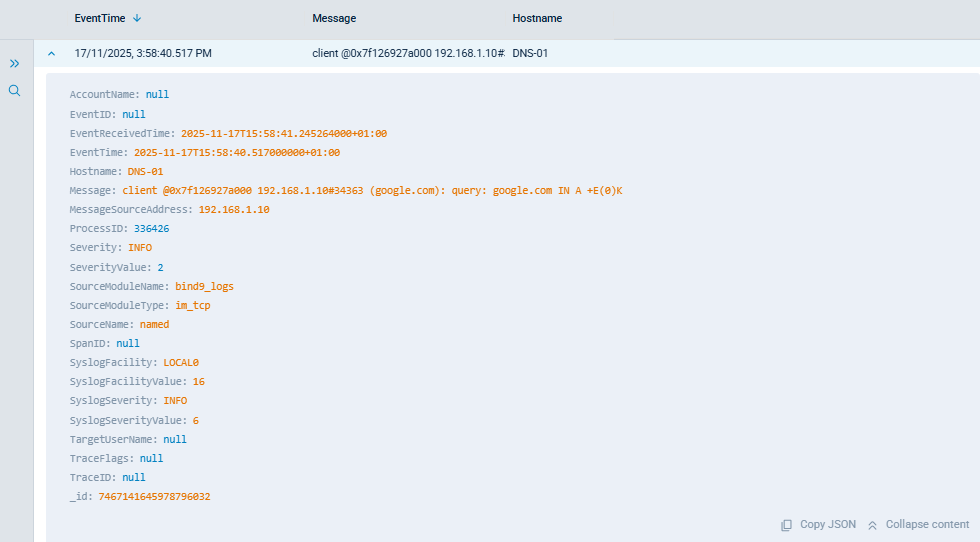
Activating logging in syslog format is easy, but the output is unstructured and can be cryptic. A typical BIND9 query event might look like the following:
<134>Nov 17 15:58:40 DNS-01 named[336426]: 2025-11-17T15:58:40.517 client @0x7f126927a000 192.168.1.10#34363 (google.com): query: google.com IN A +E(0)KYou will notice that:
-
The client IP, port, and queried domain are logged.
-
Flags like
+E(0)Krequire additional interpretation. -
It does not include response data and transport type.
-
You need to parse the event using regex to extract the fields.
Despite its limitations, syslog works well for quick operational monitoring or smaller infrastructures where you don’t need the full DNS context. Syslog will be enough if:
-
You want a fast deployment.
-
Your existing telemetry pipeline already handles syslog.
-
You only need basic operational visibility.
-
You need to keep the storage and CPU overhead low.
If you rely on a Unix or Linux syslog pipeline for BIND9, our comparison of rsyslog vs syslog-ng can help you evaluate which syslog daemon best fits your environment.
When BIND9 dnstap is a better fit
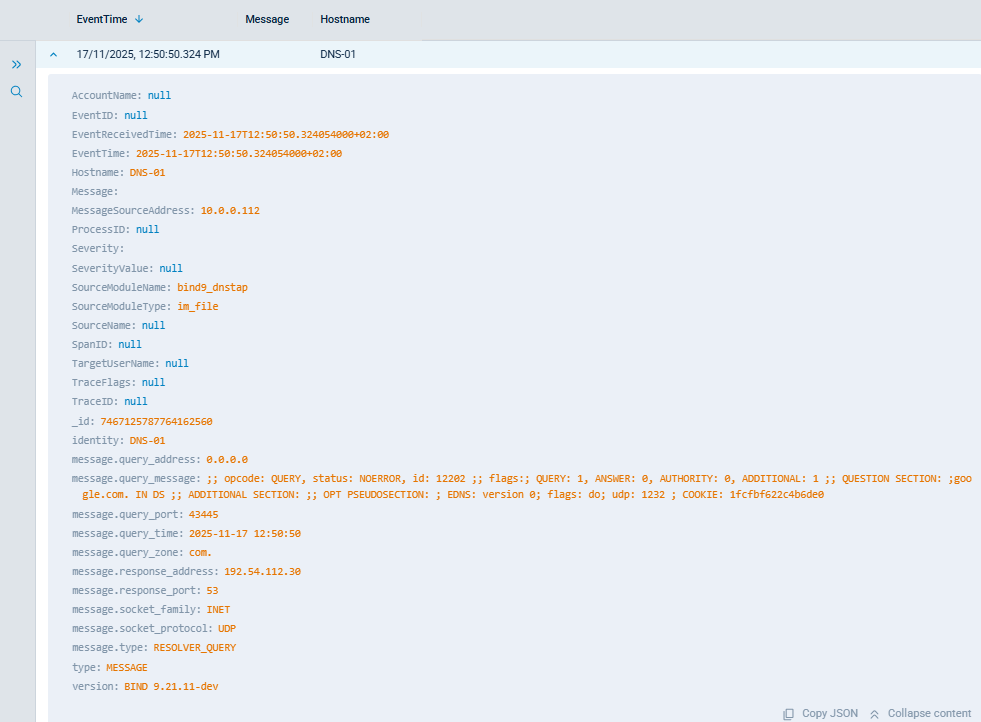
Once converted to JSON, dnstap logs provide much more context. For example, the following is an example of a query event:
{
  "type": "MESSAGE",
  "identity": "DNS-01",
  "version": "BIND 9.21.11-dev",
  "message": {
    "type": "RESOLVER_QUERY",
    "query_time": "2025-11-17T12:50:50.638731878Z",
    "socket_family": "INET",
    "socket_protocol": "UDP",
    "query_address": "0.0.0.0",
    "response_address": "192.54.112.30",
    "query_port": 43445,
    "response_port": 53,
    "query_zone": "com.",
    "query_message": ";; opcode: QUERY, status: NOERROR, id: 12202\n;; flags:; QUERY: 1, ANSWER: 0, AUTHORITY: 0, ADDITIONAL: 1\n\n;; QUESTION SECTION:\n;google.com.\tIN\t DS\n\n;; ADDITIONAL SECTION:\n\n;; OPT PSEUDOSECTION:\n; EDNS: version 0; flags: do; udp: 1232\n; COOKIE: 1fcfbf622c4b6de0\n"
  }
}
With dnstap events, you get:
-
Full query and response context.
-
Transport details.
-
Metadata and flags.
-
High-resolution timestamps.
This information makes dnstap events more suitable for security monitoring, forensic analysis, and environments that require granular DNS visibility. Dnstap is the stronger option when:
-
You need full DNS query and response telemetry.
-
You rely on SIEM, security analytics, or DNS forensics.
-
Your environment generates a high volume of DNS traffic.
-
You want precise timing, metadata, and structured logs.
Collecting BIND9 logs with NXLog Agent
NXLog Agent can collect BIND9 logs using the appropriate input module for each approach.
syslog
When your syslog daemon forwards BIND9 log events over TCP, use the TCP input module with the Syslog extension to receive and parse them:
<Extension syslog>
    Module        xm_syslog
</Extension>

<Input in_bind9_syslog>
    Module        im_tcp
    ListenAddr    0.0.0.0:1514
    <Exec>
        parse_syslog();
        if $Message =~ /^(?<EventTime>\d+-\d+-\d+T\d+:\d+:\d+\.\d+)\s(?<Message>.*)$/ {
            $EventTime = parsedate($EventTime);
        }
    </Exec>
</Input>
The parse_syslog() call extracts the severity, facility, hostname, process name, and process ID from the syslog header.
The regular expression then overrides $EventTime with the BIND9 internal timestamp for better precision, leaving the DNS query details in the $Message field.
dnstap
Setting up BIND9 for dnstap output requires BIND9 to be compiled with dnstap enabled and the fstrm, protobuf, and dnstap-tools dependencies installed.
Refer to the BIND9 and dnstap documentation for setup instructions.
Once BIND9 is writing events to a Unix socket, use the dnstap command-line tool to stream them and write the output as newline-delimited JSON to a file:
dnstap -u /var/run/bind/dnstap.sock -j -w /var/log/dns-logs.jsonThen configure NXLog Agent to read that file and parse each event with the JSON extension:
<Extension json>
    Module     xm_json
    Flatten    TRUE
</Extension>

<Input bind9_dnstap>
    Module     im_file
    File       '/var/log/dns-logs.json'
    Exec       parse_json();
</Input>
This makes all structured dnstap fields available, including message.type, message.query_time, message.socket_protocol, message.query_address, and message.response_address.
Conclusion
Understanding the differences between BIND9 syslog and dnstap logging is key to choosing the right DNS logging strategy for your environment. Syslog offers simplicity and quick integration with existing pipelines, while dnstap delivers structured telemetry for deeper visibility and security analysis.
NXLog Platform’s agent supports both syslog-based BIND9 logs and dnstap collection, making it easy to integrate your chosen approach into a reliable and scalable telemetry pipeline. If you’re planning to refine your DNS monitoring strategy, our team can guide you through the setup. Reach out to us for more information.