
Timely visibility into system activity is what separates effective defense from reactive analysis. Every operating system, application, and device logs a trail of evidence. However, transforming that trail into actionable intelligence requires the right tools. In our previous posts, we’ve walked you through:
In this final installment in our series on log visualization, we’re turning our attention to Linux security monitoring. We will look at how to collect system and authentication logs with NXLog Agent and transform them into security dashboards with Elasticsearch and Kibana. Whether you have a few critical servers or a large fleet of Linux hosts, this information gives your SOC analysts and IT teams the context they need to detect anomalies and enforce compliance.
Why monitor Linux security events?
Linux forms the backbone of most enterprise and cloud infrastructures, but monitoring it effectively is not straightforward. Unlike Windows, which consolidates security events into a single location, Linux distributes its events across multiple files. Each source captures part of the story, but no single log file provides the whole picture. Additionally, routine system activity often buries the events that signal risk in these log files.
Despite these challenges, monitoring Linux is critical for three main reasons:
- Detecting security threats early on
-
Failed SSH login attempts, unexpected sudo activity, privilege escalations, and suspicious process executions can all be early signs of malicious activity, including brute-force attacks, lateral movement, or unauthorized access. Only continuous monitoring helps detect these before they become full-blown incidents.
- Compliance and auditing
-
Frameworks like PCI DSS, ISO 27001, and CIS Benchmarks require organizations to retain and review system activity logs. Having centralized visibility over authentication and configuration changes ensures you can meet these requirements and demonstrate control over your environment.
- Operational visibility
-
Security monitoring isn’t just about threat detection, but also about understanding how your systems behave. By centralizing and visualizing logs, you can uncover configuration drift, troubleshoot errors, and establish a baseline for regular activity.
Key Linux security events to monitor
With so many different log files and subsystems generating telemetry data on Linux hosts, monitoring everything is not feasible. Identifying the events that reveal suspicious behavior is the key to effective security monitoring.
The table below highlights the most critical Linux security events and related MITRE ATT&CK techniques. These events should be at the top of your priority list for monitoring.
| Category | File(s) | MITRE Technique | Why it matters |
|---|---|---|---|
Unauthorized cron job creation |
|
Detects creation or modification of scheduled tasks that attackers may use to establish persistence or execute malicious code. |
|
Suspicious sudo command usage |
|
Detects elevated privileges that may indicate an attacker attempting to execute unauthorized administrative actions. |
|
New user or group creation |
|
Identifies potential persistence mechanisms where attackers create new local accounts to maintain access. |
|
Execution of script from world-writable directory |
|
Flags possible execution of malicious scripts placed in insecure directories that can be modified by non-privileged users. |
|
Unauthorized access to sensitive credential files |
|
Highlights attempts to read or modify credential stores such as |
Collecting Linux security events and sending them to Elasticsearch
NXLog Agent is a lightweight, cross-platform log collection agent that can parse syslog messages into structured telemetry data. It can normalize fields and output data in JSON format, making it immediately available for viewing in Elasticsearch. Here is how we can go about it:
Elasticsearch can ingest and index high volumes of data at scale, which is what you need for monitoring Linux security events. NXLog Agent can forward events directly to it using its dedicated Elasticsearch output module, ensuring that logs are stored correctly and ready to query in near real-time.
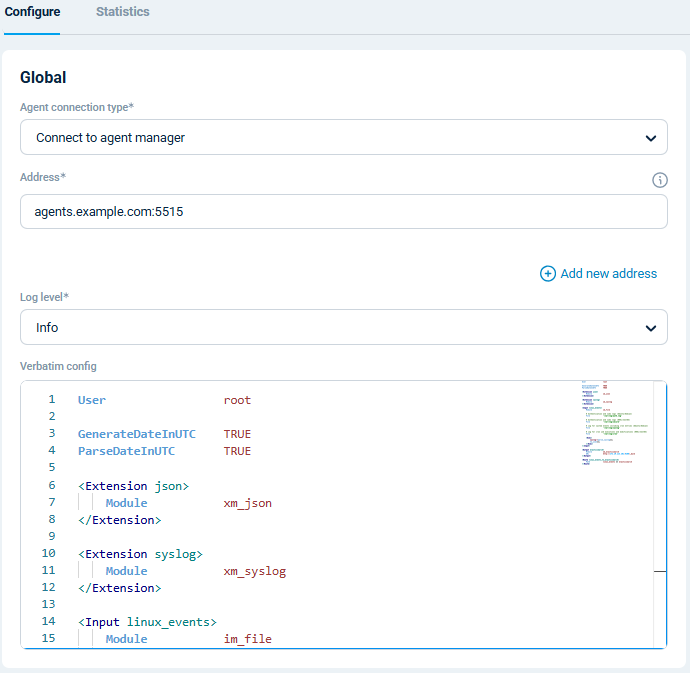
Here is the complete configuration:
User                 root (1)

GenerateDateInUTC    TRUE (2)
ParseDateInUTC       TRUE

<Extension json>
    Module           xm_json
</Extension>

<Extension syslog>
    Module           xm_syslog
</Extension>

<Input linux_events>
    Module           im_file

    # Authentication and sudo logs (Ubuntu/Debian)
    File             '/var/log/auth.log'

    # Authentication and sudo logs (RHEL/CentOS)
    File             '/var/log/secure'

    # System events including cron logs (Ubuntu/Debian)
    File             '/var/log/syslog'

    # Cron job executions and modifications (RHEL/CentOS)
    File             '/var/log/cron'

    <Exec>
        syslog->parse_syslog();
        to_json();
    </Exec>
</Input>

<Output elasticsearch>
    Module           om_elasticsearch
    URL              http://172.19.113.201:9200/_bulk (3)
</Output>

<Route linux_events_to_elasticsearch>
    Path             linux_events => elasticsearch
</Route>| 1 | Grants NXLog Agent access to read log files in the /var/log/ directory. |
| 2 | Generates and expects dates in UTC. |
| 3 | Replace the IP address and port with your Elasticsearch instance details. |
Configuring an agent is easy with NXLog Platform. Find your agent, paste the configuration into the editor, and save your changes.
You can also create a configuration and assign it to multiple agents.
With NXLog Agent handling collection and Elasticsearch providing scalable storage and search, you have a pipeline that turns raw Linux security logs into actionable insights in Kibana. We will dive into that next.
Visualizing Linux security logs in Kibana
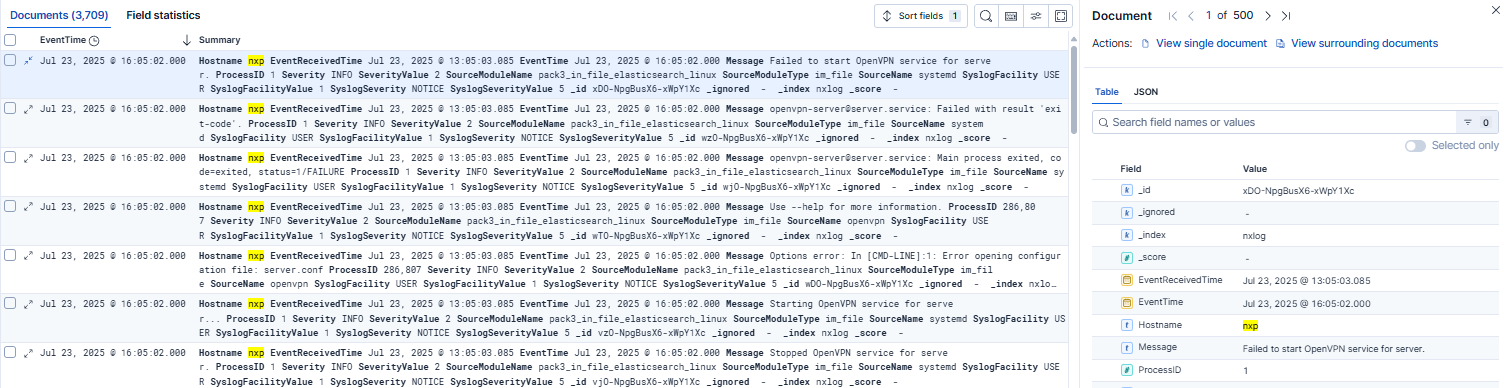
Once your Linux events are indexed in Elasticsearch, you can immediately start exploring them in the Discover page, which lets you search and filter raw events in real time. This is particularly useful for ad hoc investigations, such as examining a suspicious logon or privilege escalation.
However, you’ll get real value when you transform thousands of events into a security dashboard. A well-designed Kibana dashboard allows analysts to spot unusual system behavior at a glance. For example, you can build a Linux security dashboard containing the following widgets:
-
sudo commands over time to spot sudden increases in sudo activity or privilege escalation attempts.
-
New users and groups to highlight unplanned user and group additions.
-
Unauthorized cron jobs to detect new or modified scheduled tasks that could run malicious commands by unexpected users or at irregular times.
-
Failed SSH login attempts by source IP to surface brute-force or credential-stuffing attempts.
And much more!
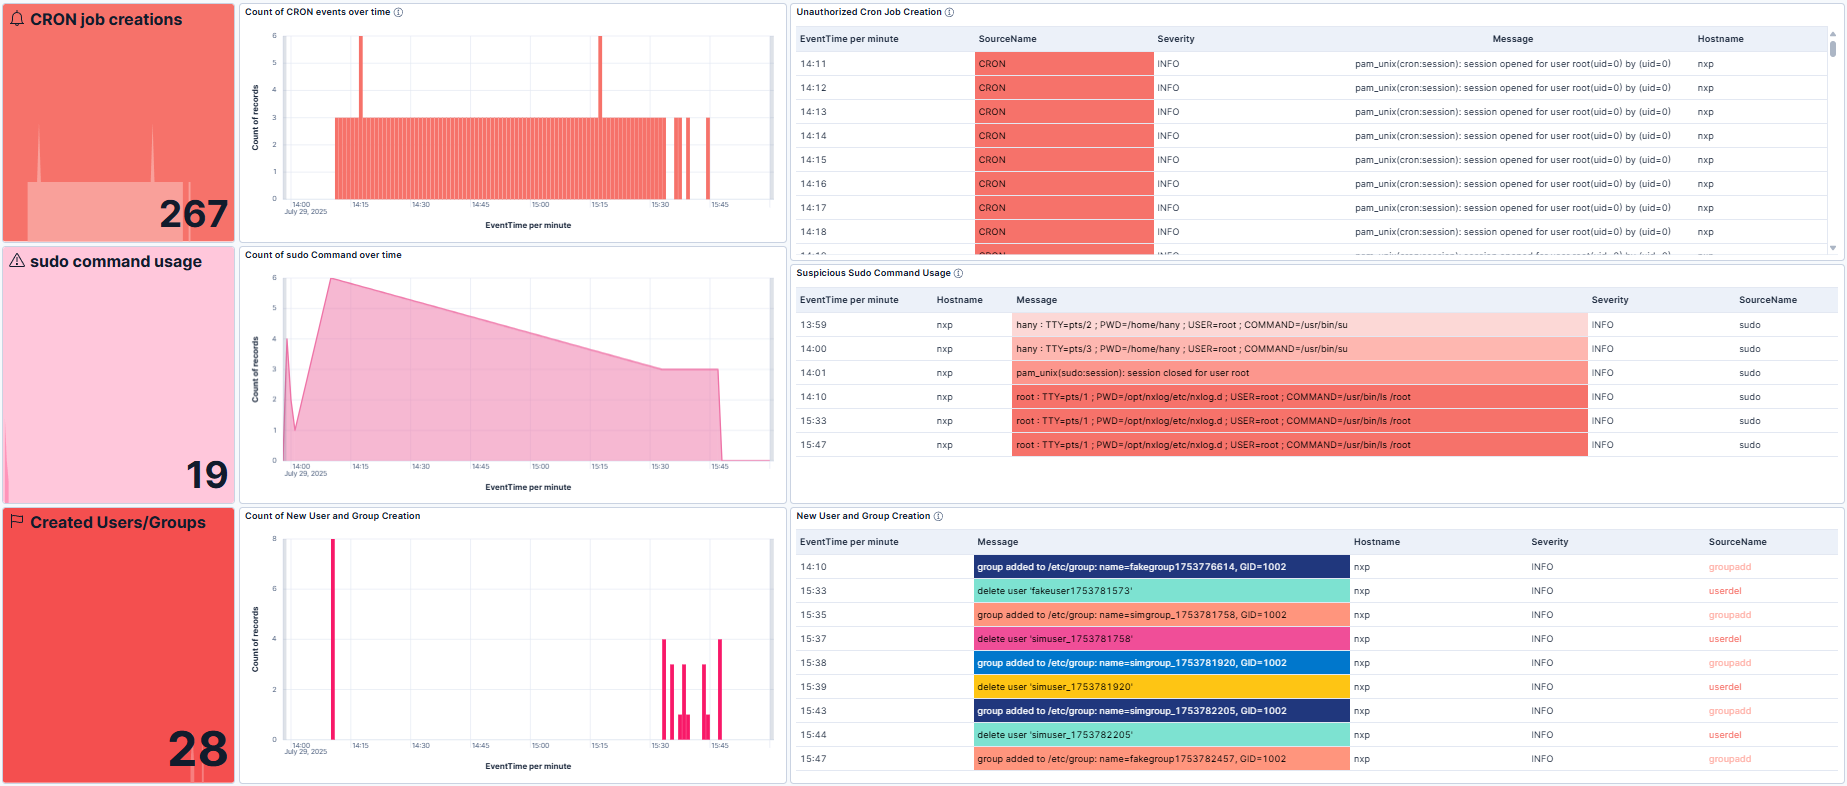
To help kick-start your monitoring journey, we’ve prepared a sample Kibana dashboard.
You can import it into Kibana by navigating to Stack Management and then clicking on Saved Objects under Kibana.
Then, click Import and upload the .ndjson file.
A thoughtfully designed dashboard provides you with invaluable insight into your infrastructure, allowing your analysts to proactively monitor for threats instead of combing through thousands of events after the fact.
Conclusion
Linux systems are at the core of most enterprise infrastructures, making monitoring them essential to maintaining security and operational integrity. Although Linux is known for its stability and security, it is not immune to misconfiguration, misuse of privileges, and malicious attacks. By collecting and centralizing Linux security logs with NXLog Agent and analyzing them in Elasticsearch and Kibana, you can uncover valuable insights that help you keep your environment secure.
At NXLog, we’ve built NXLog Platform to help organizations like yours take control of their telemetry data so they can transform raw logs into actionable security intelligence. If you’re ready to take the next step, try NXLog Agent to see how it can help you centralize your Linux security logs in Elasticsearch and Kibana.
This post concludes our series on log collection and visualization. That said, we’re always eager to hear about new use cases and explore how organizations can leverage their telemetry to strengthen security and optimize operations. If we haven’t covered your scenario, drop us a line and let us know how we can help.