
It is known that measuring performance is one of the most challenging tasks in system administration. It requires proper configuration and a good understanding of the results. Fortunately, Linux systems offer a wide variety of tools for obtaining performance metrics. In this blog post, we will focus on the instrumentation capabilities of the Linux kernel and some interesting methods of analyzing the results.
The importance of the kernel lies in the fact that usage information related to CPU, memory, disk space, or network interfaces is always passing through it, and it cannot be bypassed. Of course, there are exceptions where the kernel is not involved in an operation or is involved only at a minimum, like creating the user-space TCP/IP stack with the Data Plane Development Kit. Still, kernel events provide the most accurate and precise picture of what is happening in the system for most tasks.
There are various tools to measure a Linux system’s performance. Tools like top, iostat, mpstat, and iftop can provide answers to questions like:
-
Which process is causing excessive disk writes?
-
How many CPU cores is a specific application using?
-
Is system utilization high, moderate, or low?
The average system administrator does not usually need to go beyond these tools. But what if you need to answer more specific questions, for example:
-
How many times did a process invoke a certain syscall, and what were the results?
-
How successful was a process at opening an external device, like a USB drive?
-
How much time must a device wait before its interrupt is serviced?
ftrace is a kernel event tracing tool that can easily answer these questions. It has been available since version 2.6 and is essentially a keyhole into the kernel, allowing a user to subscribe to certain types of events or functions. This excerpt from the tool’s readme file written by its author, Steven Rostedt, describes it perfectly:
Ftrace is an internal tracer designed to help out developers and system designers, to find what is going on inside the kernel. It can be used for debugging or analyzing latencies and performance issues that take place outside of user-space.
At the heart of ftrace lies a circular buffer where events are aggregated by tracers.
By tracer, we mean kernel code capable of collecting certain types of events.
ftrace is built on top of debugfs, so its environment is exposed in /sys/kernel/debug/tracing.
For example, to get the list of available tracers, one can consult this file:
# cat /sys/kernel/debug/tracing/available_tracers
hwlat blk mmiotrace function_graph wakeup_dl wakeup_rt wakeup function nop
This represents the tracing facilities available by default on most machines.
But the Linux kernel supports numerous other interesting tracers that can be observed by looking in the kernel/trace/trace_*.c files of the Linux source tree.
They can be activated by recompiling the kernel with the necessary configuration options.
[~/my-kernel-source/kernel/trace]$ ls  trace_*.c
trace_benchmark.c   trace_events_filter.c    trace_hwlat.c            trace_output.c            trace_selftest_dynamic.c
trace_boot.c        trace_events_hist.c      trace_irqsoff.c          trace_preemptirq.c        trace_seq.c
trace_branch.c      trace_events_inject.c    trace_kdb.c              trace_printk.c            trace_stack.c
trace_clock.c       trace_events_synth.c     trace_kprobe.c           trace_probe.c             trace_stat.c
trace_dynevent.c    trace_events_trigger.c   trace_kprobe_selftest.c  trace_recursion_record.c  trace_syscalls.c
trace_eprobe.c      trace_export.c           trace_mmiotrace.c        trace_sched_switch.c      trace_uprobe.c
trace_event_perf.c  trace_functions.c        trace_nop.c              trace_sched_wakeup.c
trace_events.c      trace_functions_graph.c  trace_osnoise.c          trace_selftest.c
For example, by reading the comments in the trace_clock.c source code, we can figure out what it is about:
-
Implements 3 trace clock variants with differing scalability/precision
-
Tradeoffs:
-
Local: CPU-local trace clock
-
Medium: scalable global clock with some jitter
-
Global: globally monotonic, serialized clock
-
I’m providing these examples to illustrate just how low the entrance barrier is for getting started with Linux kernel tracing.
Out of the available standard tracers, we’ll concentrate on blk, which allows tracing block I/O operations.
So let’s take a deeper look!
Block I/O tracer
It’s not a secret that disk throughput is sometimes a limiting factor in high-performance computing.
Modern SSD disks show a read/write rate of hundreds of megabytes per second, while DDR memory performance starts in the thousands.
Locating a bottleneck in the disk I/O subsystem has always been a challenge.
For years Linux systems offered well-known tools like iostat, but their output is limited, providing only average numbers gathered over a defined period.
It does not tell us how many disk operations occurred and what the size of those operations was.
In 2007 a new tool, blktrace, appeared.
It sits on top of the ftrace subsystem mentioned above and uses the blk tracer.
It is a valuable tool for tackling the following tasks:
-
Analyzing the I/O performance of disks
-
Estimating the exact cost of adding new resources, like software RAID
-
Comparing different disk configurations
-
Finding the optimal disk configuration for a specific software task
-
Analyzing the performance of different file systems that reside on top of block devices
Running blktrace for the first time
Let’s jump right into the example. Try running the following command as a superuser:
# blktrace -d /dev/sda -w 3 -o - | blkparse -i -Substitute sda with an adequate disk available on your system.
You’ll immediately see an avalanche of console output, followed by a summary report after about 3 seconds.
Each line of output corresponds to a disk-related operation.
A brief explanation of the command line options used above:
-
-dmeans a device to monitor. -
-w 3means wait for 3 seconds and exit. -
-o-means write the gathered data to the standard output.
Remember that blktrace does not generate any readable data, so its output is usually redirected to a file or — if you need real-time data collection — to a parsing program that can translate binary data into readable text.
This is what -o- and -i- expressions are used for, and blkparse is the tool we need, which is usually bundled with the same OS package as blktrace.
Let’s see how we can interpret each line. This knowledge will help us further when we build our real-time analytics.
8,0 2 145 0.961955712 3140264 I WS 3568367616 + 1160 [elasticsearch[i]-
8,0: The device’s major and minor numbers. You can see this by runningls -l /dev/sda. -
2: CPU core number -
145: Sequence number relative to the start of the execution -
0.961955712: Timestamp of the operation, relative to the start of the execution, in seconds and microseconds -
3140264: Process ID of the initiating application -
I: Type of action; here, "I" is "insertion into the request queue." -
WS: Type of operations; here, we have Synchronous Write. -
3568367616: Block number to start writing from -
1160: Number of blocks to write -
elasticsearch: The process name
Collecting events on a large scale
The vast amount of data collected needs to be fed into an analytics platform to make sense.
We’ll use Elasticsearch in conjunction with Kibana since these tools are designed to work together.
So how do we send the data to Elasticsearch?
Fortunately, this can easily be achieved with NXLog Agent, which provides an interface to Elasticsearch and numerous other destinations.
It will save us from digging into the internals of the Elastic API and writing error-prone, handcrafted scripts.
Additionally, NXLog Agent can easily be configured to collect and parse all block I/O events coming from blkparse, but first, some additional steps need to be taken.
Prepare the output format
You can use a regular expression to parse the input data with NXLog Agent.
Alternatively, you can modify the default blkparse output to a different format, such as “key-value” pairs.
This also gives you the ability to choose what data to log.
For example, the following command assumes you’re not interested in the major-minor device identifiers, and that you would like to retrieve the number of bytes per operation instead of the default number of blocks:
# blktrace -d /dev/sda -o- | blkparse -f "EventTime=%z,CpuIndex=%c,NanoTime=%T.%9t,PID=%p,Action=%a,RWBS=%d,Bytes=%N,Cmd=%C\n" -i -The output will look like this:
EventTime=20:09:02.077001,CpuIndex=2,NanoTime=0.000076323,PID=2868167,Action=D,RWBS=WS,Bytes=20480,Cmd=firefoxDoesn’t that look much nicer than the default format?
Configure NXLog
Although configuring NXLog to process these logs is a simple task, there are some caveats that you should be aware of.
First, blkparse log lines only include the time of the event, not the date.
This is a problem if you need to create reports spanning multiple days.
The analytics platform needs both the date and time to make sense of the data.
A simple workaround for this issue is to use NXLog’s built-in EventReveivedTime field.
In most cases, the date that the event is processed is the same as the event date, so this is a safe assumption.
Second, running a kernel trace requires superuser permissions.
By default, on Linux, the NXLog process runs with the dedicated nxlog user, which has fewer privileges as a best security practice.
A possible workaround is to wrap our chained command into a script and declare blktrace as sudo-capable without asking for a password.
To achieve this, add the following line in the /etc/sudoers file:
nxloguser ALL=(ALL) NOPASSWD: /usr/bin/blktraceWhile it is not the best approach security-wise, it is sufficient for this demonstration.
Finally, use the following NXLog configuration to collect kernel events:
<Extension kvp>
    Module          xm_kvp
    KVPDelimiter    ,
    KVDelimiter     =
    EscapeChar      \\
</Extension>

<Extension json>
    Module          xm_json
</Extension>

<Input from_blk>
    Module          im_exec
    Command         /path/to/blk_trace_parse.sh
    <Exec>
        if $raw_event !~ /^EventTime/
        {
            drop();
        }
        else
        {
            kvp->parse_kvp();
            if string($EventReceivedTime) =~ /^(\d{4})-(\d{2})-(\d{2})/
            {
                $EventTime = parsedate($1 + "-" + $2 + "-" + $3 + " " + $EventTime);
                to_json();
            }
            else drop();
        }
  </Exec>
</Input>

<Output to_elastic>
    Module          om_elasticsearch
    URL             http://localhost:9200/_bulk
    Index           "blk-test"
</Output>

<Route r1>
    Path            from_blk => to_elastic
</Route>
The following is an sample script that can be used with the im_exec input module:
#!/bin/bash
sudo blktrace -d /dev/nvme0n1 -o- | blkparse -f \" ...|
Note
|
The full command line parameters are omitted; they were discussed earlier. |
Setting up Elasticsearch and Kibana
Now it’s time to see our data in action with Elasticsearch and Kibana. We will not go into detailed installation instructions for these tools, but the following steps apply to most Linux distributions.
-
Download the latest Elasticsearch and Kibana packages from the official website, or install them using your operating system’s package manager.
-
Extract the archives (if you downloaded the
.TAR.GZpackage) to the desired location. For example, the files can be placed in a non-privileged user directory, e.g., the user’s home directory. -
Point Kibana to Elasticsearch by uncommenting or adding the following line in the
kibana.ymlconfiguration file:elasticsearch.hosts: [http://localhost:9200] -
Start both platforms using your operating system’s service manager or from the console:
$ cd /path/to/elastic/folder/bin && ./elasticsearchAnd in another console window:
$ cd /path/to/kibana/folder/bin && ./kibanaSuperuser privileges are not required. In fact, it is actually discouraged to run Elasticsearch and Kibana as a superuser. Once you have started both platforms, you should see an avalanche of console output pouring in. Give it some time, and when the flow decreases, it is an indication that both tools are up and running.
Kernel events analytics in action
Open your Kibana instance for the first time by loading http://localhost:5601 from a local browser.
The first time you access Kibana, you will be asked to add data by integrating with an external data provider or uploading a file.
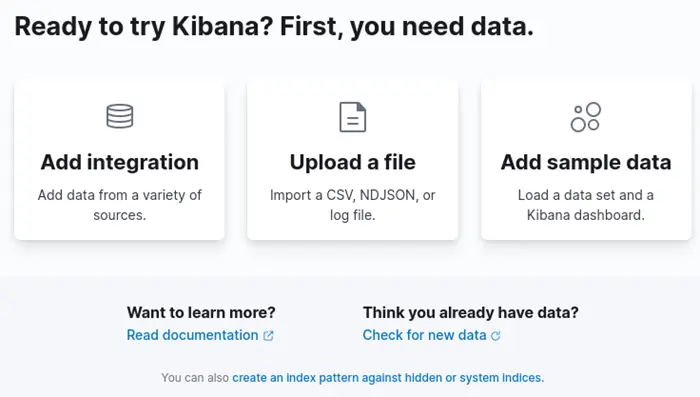
Close this dialog and instead navigate to Management > Stack management > Index patterns. To avoid creating our index using the Elastic API, we can start NXLog at this stage to create our index automatically.
Start the NXLog service using your operating system’s service manager or use the following command:
$ /opt/nxlog/bin/nxlog -f -c /opt/nxlog/etc/nxlog.confThis command starts NXLog in foreground mode and provides an explicit path to the configuration file we created above. As a result, you should instantly see the successful connection to your Elasticsearch instance, for example:
2022-04-05 13:55:45 INFO [om_elasticsearch|to_elastic] successfully connected to localhost([::1]):9200Refresh the Index Management page, and you should see the following screen:
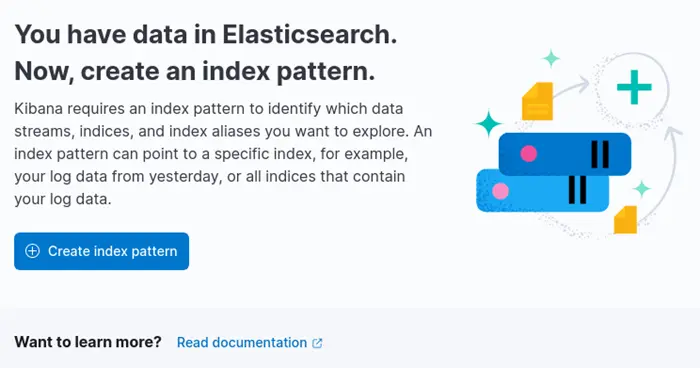
Click Create Index pattern.
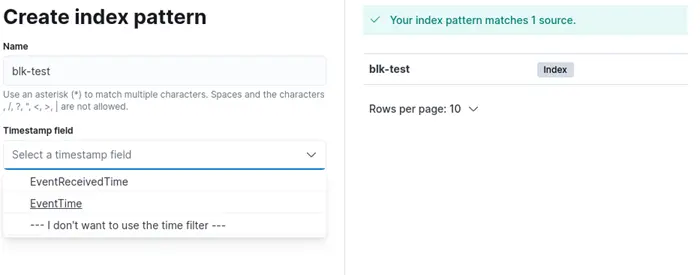
Enter the name of the index corresponding to the NXLog configuration.
In this case, we use blk-test from our example above.
Then, in the Timestamp field dropdown, select the EventTime field.
Note that we do not have to instruct Elasticsearch on how to parse the timestamp field because we construct the expected date format by Elasticsearch in the NXLog configuration file.
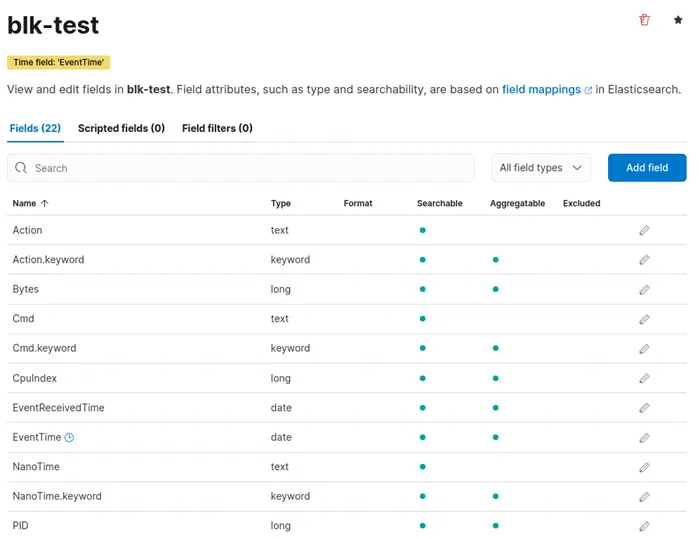
Finally, you should see all the fields as follows:
Now go to Discover and verify that the data is present. Select Last 1 hour in the date range field, and you should see a nice histogram similar to the following:
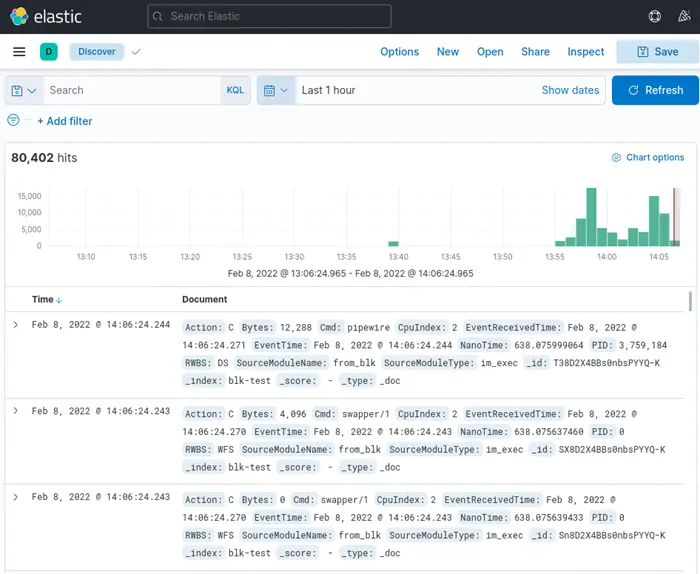
You can also enable the auto-refresh feature to view updated data in real-time mode. Under Refresh every enter 5 seconds and click Start.
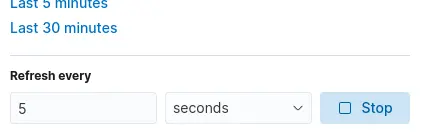
The graph will auto-scroll to the left when new data is displayed.
Finally, let’s create a practical real-time scenario for analyzing writing pressure on the disk.
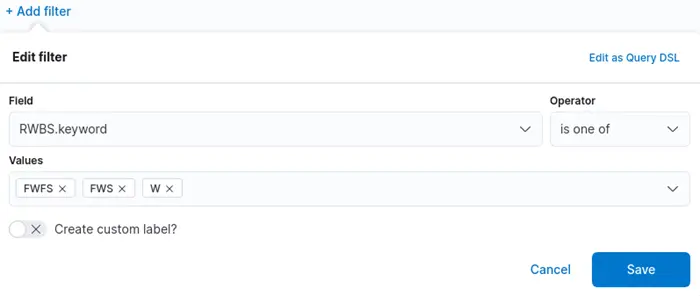
Go to Visualize Library and filter out anything that is not related to writing operations by entering all types of RWBS fields that contain W (write):
Next, create an aggregation to visualize the total number of bytes grouped by application name:
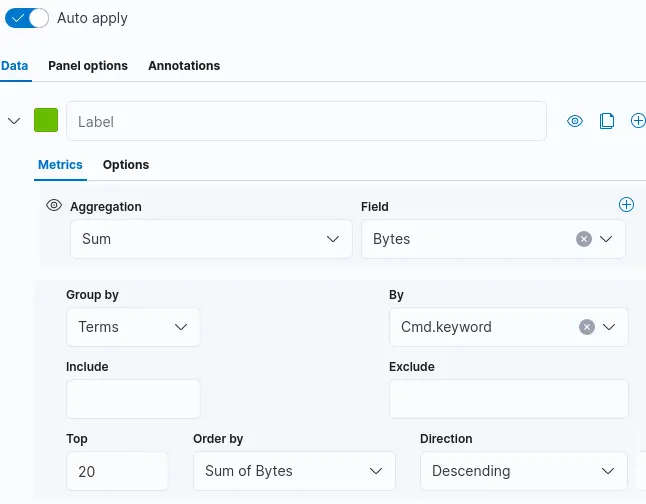
You should see a graph similar to the following:
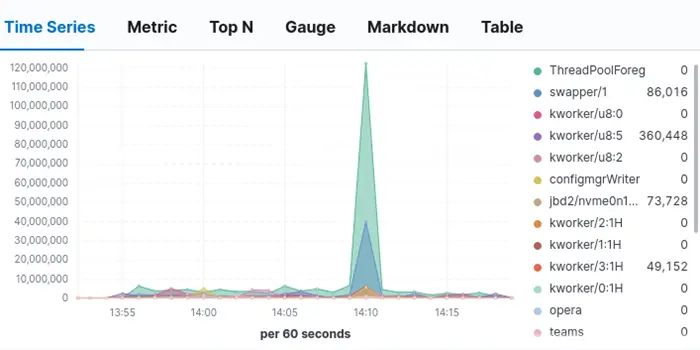
There is one caveat here; you probably expect to see recognizable application names, but you will notice that the list contains some unusual application names.
If a process spawns a thread, the thread name will be listed instead of the program name itself.
In the screenshot above, ThreadPoolForeg is a thread name belonging to Webkit-based web browsers like Opera and Chrome.
Additionally, names like kworker/u8:2 or swapper/1 are kernel threads.
In short, you may need to research which application each thread name belongs to.
Conclusion
This blog post demonstrates how to combine precise kernel tracing with data analytics. With this approach, you can have confidence in the data you are measuring since there are no intermediate programs in the pipeline that could impose algorithms and skew the results. Instead, raw numbers are inserted directly into your analytics platform, avoiding possible intermediate bias.
While this example works for a small dataset, things may be different on a live server where the data flow volume can be huge. A continuous large data stream may lead to substantial resource consumption by the Elasticsearch process, resulting in a noticeable contribution to disk usage statistics by the log collection toolchain (NXLog Agent → Elasticsearch → Kibana). One solution would be to distribute the load so that the system-under-test, the log collection agent, and the analytics platform run on separate machines. In any case, NXLog Agent provides a myriad of options you can use to create an optimal workflow based on your requirements and resource constraints.