
NXLog supports direct collection of Event Tracing for Windows (ETW) data. DNS Analytical logs, for example, can be forwarded to Splunk or another SIEM for monitoring and analysis.
Collecting ETW Logs
Event Tracing for Windows (ETW) is a kernel-level tracing facility that provides high-performance logging of kernel and application events. ETW events can be written to a log file or collected directly from the system in realtime via the Consumers API. ETW is a valuable source of event data that is underutilized compared to the well-known Windows Event Log. The Debug and Analytical channels, which are based on ETW, cannot be collected through Windows Event Log directly. For more information, see our white paper Solving Windows Log Collection Challenges with Event Tracing.
ETW logging is of particular interest for collecting DNS Server activity logs. Prior to Windows Server 2012 R2, activity logs were only available through DNS Server’s debug logging feature (See DNS Debug Logging in the NXLog User Guide.) Unfortunately, debug logging can significantly impact DNS Server performance and it was never intended to be enabled permanently. With the introduction of DNS Server Analytical logs in Server 2012 R2 and 2016, high-performance DNS activity logging is available through ETW.
> logman query providers
Microsoft-Windows-DNSServer              {EB79061A-A566-4698-9119-3ED2807060E7}
[...]
> logman create trace DNSTrace -p Microsoft-Windows-DNSServer -o c:\trace.etl
> logman start DNSTrace
[Wait for activity to be logged]
> logman stop DNSTrace
> logman delete DNSTrace> tracerpt c:\trace_000001.etl
[...]
DumpFile: dumpfile.xml
Summary: summary.txtWhile these tools are suitable for working with temporary traces, they do not offer a good solution for setting up regular collection of ETW logs. A similar multi-stage process would need to be implemented to use the Splunk Universal Forwarder for Windows, as it does not support ETW directly.
NXLog Enterprise Edition, however, implements the ETW Consumers API to collect
ETW events directly from the source for robust, efficient ETW logging. NXLog
handles tracing setup, so it is not necessary for the user to run logman or
tracerpt commands. NXLog does not require events to be written to disk,
reducing the overhead required and allowing NXLog to perform well even at high
event rates.
Configuring the HEC Data Source in Splunk
Before adding the NXLog configuration, a new log source needs to be added in Splunk to receive the logs.
-
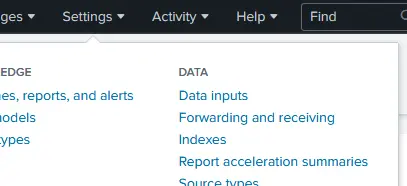
In the Settings menu, click Data inputs.
-
In the Local Input section, for the HTTP Event Collector input type, click Add new, then select New Token.
-
To configure the input source, enter the Name, then click Next. The remaining settings are optional.
-
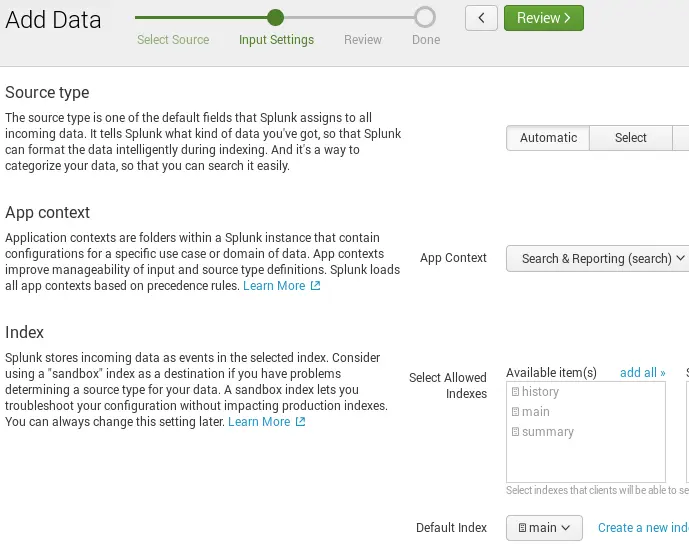
In the input settings, select Automatic or set the Source type to json, choose an App context; for example, Search & Reporting (search). The remaining settings are optional, then click Review.
-
Once reviewed, select Submit, then copy the Token for future use in the NXLog configuration.
-
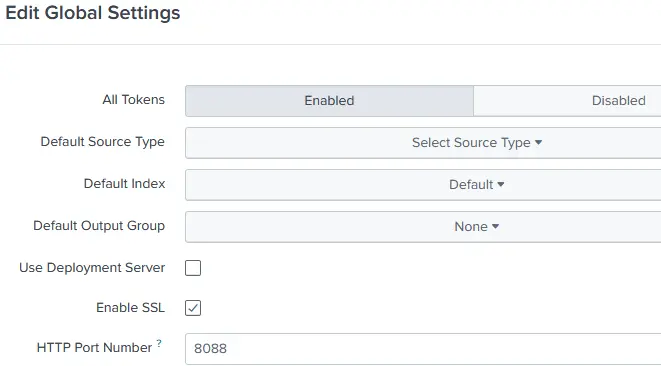
Returning back to the HTTP Event Collector page, select the Global Settings button.
-
Select Enabled to enable Tokens, select Enable SSL if using SSL, then take note of the HTTP Port Number as it will be used in the NXLog configuration.
Now that an appropriate Splunk log source has been configured, you can continue by setting up NXLog Enterprise Edition to collect and forward ETW logs.
Configuring NXLog to Collect and Forward ETW Logs via HEC
NXLog can collect logs from ETW with the im_etw module. The Provider directive specifies the ETW provider to collect logs from, while the optional Level directive can be used to select a log level (the default is the "verbose" level). It is also possible to collect kernel trace logs with the KernelFlags directive and a comma-separated list of flags. For full configuration details, see im_etw in the NXLog Reference Manual.
|
Note
|
DNS Server Analytical logging is available beginning with Windows Server 2012 R2. For more information, and an alternative method for previous versions of Windows Server, see Windows DNS Server in the NXLog User Guide. |
In the following configuration, NXLog reads DNS Server Analytical logs directly
from the Microsoft-Windows-DNSServer ETW provider using the im_etw input module.
<Input in_dns>
    Module      im_etw
    Provider    Microsoft-Windows-DNSServer
</Input>Send logs to the Splunk HEC endpoint by Configuring HTTP Event Collection (HEC) both on Splunk and NXLog.
Specify the HTTP Port Number and Token using the URL and AddHeader directives, respectively. For example, https://127.0.0.1:8088/services/collector and Authorization: Splunk 452d2e2d-b5c5-4001-bd47-d181de90af99.
Enable SSL via the HTTPSCAFile directive available in the om_http module if it is not already set in the Splunk configuration file.
The configuration sample below shows the output module instance with the
necessary connection parameters as well as the processing needed in the
<Exec> block to match the metadata and data formats Splunk expects to receive.
<Extension _json>
    Module  xm_json
</Extension>

<Output splunk_out_hec>
    Module      om_http
    URL         https://127.0.0.1:8088/services/collector
    AddHeader   Authorization: Splunk 452d2e2d-b5c5-4001-bd47-d181de90af99
    HTTPSCAFile %CERTDIR%/cacert.pem
    <Exec>
        # Rename event fields to what Splunk uses
        if $Severity rename_field($Severity, $vendor_severity);
        if $SeverityValue rename_field($SeverityValue, $severity_id);

        # Convert all fields to JSON and write to $event field
        $event = to_json();

        # Convert $EventTime to decimal seconds since epoch UTC
        $time = string(integer($EventTime));
        $time =~ /^(?<sec>\d+)(?<ms>\d{6})$/;
        $time = $sec + "." + $ms;

        # Specify the log source type
        $sourcetype = "_json";

        # Add other HEC metadata fields if available in the event data
        if $Hostname $host = $Hostname;
        if $SourceName $source = $SourceName;

        # Remove all non-metadata fields (already stored in $event)
        clean_splunk_fields->process();

        # Write to JSON
        to_json();
    </Exec>
</Output>Add a route for the ETW logs. If no route is specified in the configuration, NXLog will automatically create a single default route connecting all inputs to all outputs.
<Route splunk>
    Path    in_dns => splunk_out_hec
</Route>
The nxlog service should be restarted to apply the new configuration.
Confirming Log Collection in Splunk
To confirm data collection, go to the Splunk Search & Reporting dashboard and search for the correct logs, using either host name or source name.
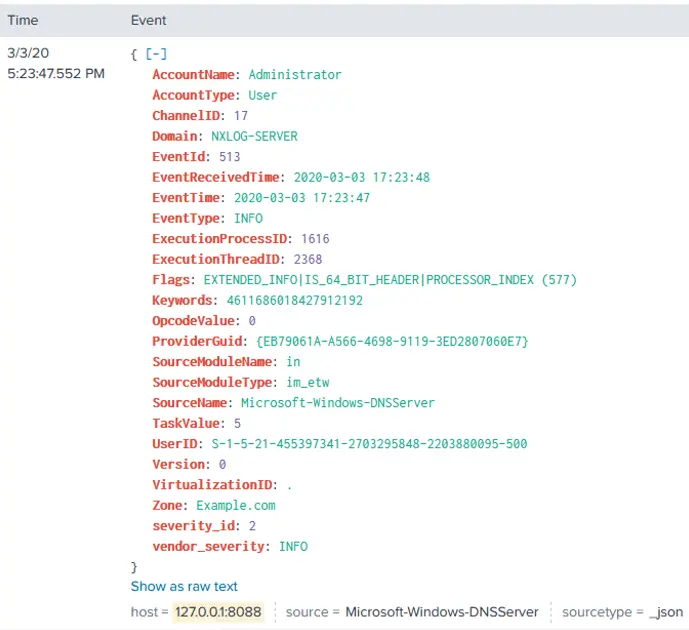
Once forwarded to Splunk, administrators can leverage Splunk’s features such as visualizations, alerts, and other Splunk apps.
To read more about Splunk, please see the Splunk integration guide or contact us if you are interested in learning how NXLog can further enhance your Splunk deployments.