
With an ever-expanding choice of technologies on the market, navigating the range of open-source observability tools can be a challenge. Which is why, when it comes to managing complex multicloud environments and their services, standardization is crucial. Here’s where OpenTelemetry (OTel) can play a key role. Developed through the merger of OpenCensus and OpenTracing, OpenTelemetry has become the new standard for open-source telemetry.
Discover what OTel is, the types of telemetry data it encompasses, its potential benefits, and how NXLog can support your OpenTelemetry ecosystem.
What is OpenTelemetry?
To understand the significance of OpenTelemetry, you first need to understand 'observability'. In simple terms, observability describes how organizations can gain insight into a system’s state by analyzing the data it generates – typically logs, metrics, and traces.
OpenTelemetry, also known as OTel, is an open-source observability framework composed of tools, APIs, and SDKs. It allows IT teams to instrument, generate, collect, and export telemetry data, enabling them to analyze and understand the performance and behavior of software. There are many options – both free and commercial – for enabling observability. OTel’s goal is to provide unified, vendor-agnostic libraries and APIs for streamlining data collection and transmission.
OTel was developed through the joining of OpenTracing and OpenCensus. OpenTracing became a CNCF project in 2016. Then, in 2018, Google open-sourced the OpenCensus project – originally based on its internal Census library, which was used for gathering traces and metrics from distributed systems. Both aimed to offer a vendor-neutral library for collecting tracing and metrics data. The original beta version of OpenTelemetry was released in March 2020 and has since become the second most active CNCF project, after Kubernetes.
What is Telemetry Data?
Telemetry data primarily refers to logs, metrics and traces, the capturing of which is essential for understanding and troubleshooting the performance of your applications and infrastructure. This data is collected from various remote and often hard-to-reach points within your ecosystem. And its sheer volume presents a challenge for long-term storage, which has capacity constraints. This makes cloud storage services – both private and public – invaluable for DevOps teams.
Examples of telemetry data include:
-
Logs – an event-based record of significant actions and anomalies within a system. These readable files – structured or unstructured – offer insights into the outcomes of transactions involving endpoints in your environment. However, these logs aren’t always easy to review, prompting the development of external log analysis tools.
-
Metrics – numerical data points representing counts or measures, which are often aggregated over time. These come from various sources, including infrastructure, hosts, and third-party services. Unlike logs, metrics are generally accessible via queries, and their timestamps, values, and event names can help detect potential issues that need attention.
-
Traces – these track a process from start to finish, such as an API request or other system activity, illustrating how services interact. Monitoring these pathways is crucial for understanding how an ecosystem operates, whether it’s functioning efficiently, and if troubleshooting is needed. Traces are characterized by span data, which includes unique identifiers, operation names, timestamps, logs, events, and indexes, providing detailed insights into system behavior.
How Does Telemetry Data Work?
OTel serves as a specialized protocol for collecting telemetry data and exporting it to a target system. As an open-source CNCF project, its goal is to make data collection more system-agnostic.
The data lifecycle has several stages, each generating different types of data. These stages are:
-
Instrumentation: The first step is to instrument the code with APIs, which specify what metrics to collect and how to gather them. OpenTelemetry supports zero-code instrumentation for popular programming languages.
-
Collection: SDKs pool the data, preparing it for processing and export.
-
Processing: The collected data is broken down, sampled, filtered to reduce noise or errors, and enriched by adding contextual information from multiple sources.
-
Transformation: The data is then converted and exported in a usable format.
-
Delivery: Sending the data to the desired destination/s (APM, SIEM, long-term storage, etc.)
OpenTelemetry components
OTel is made up of several key components:
APIs: These core components are language-specific (e.g., Java, Python, .NET) and enable the integration of your application with OTel.
SDKs: Also language-specific, an SDK acts as a bridge between the APIs and the exporter. It also allows for additional configurations, such as request filtering and transaction sampling.
Exporter: This component enables you to configure which backend(s) the telemetry data is sent to. It decouples the instrumentation from the backend configuration, making it easy to switch backends without having to re-instrument your code.
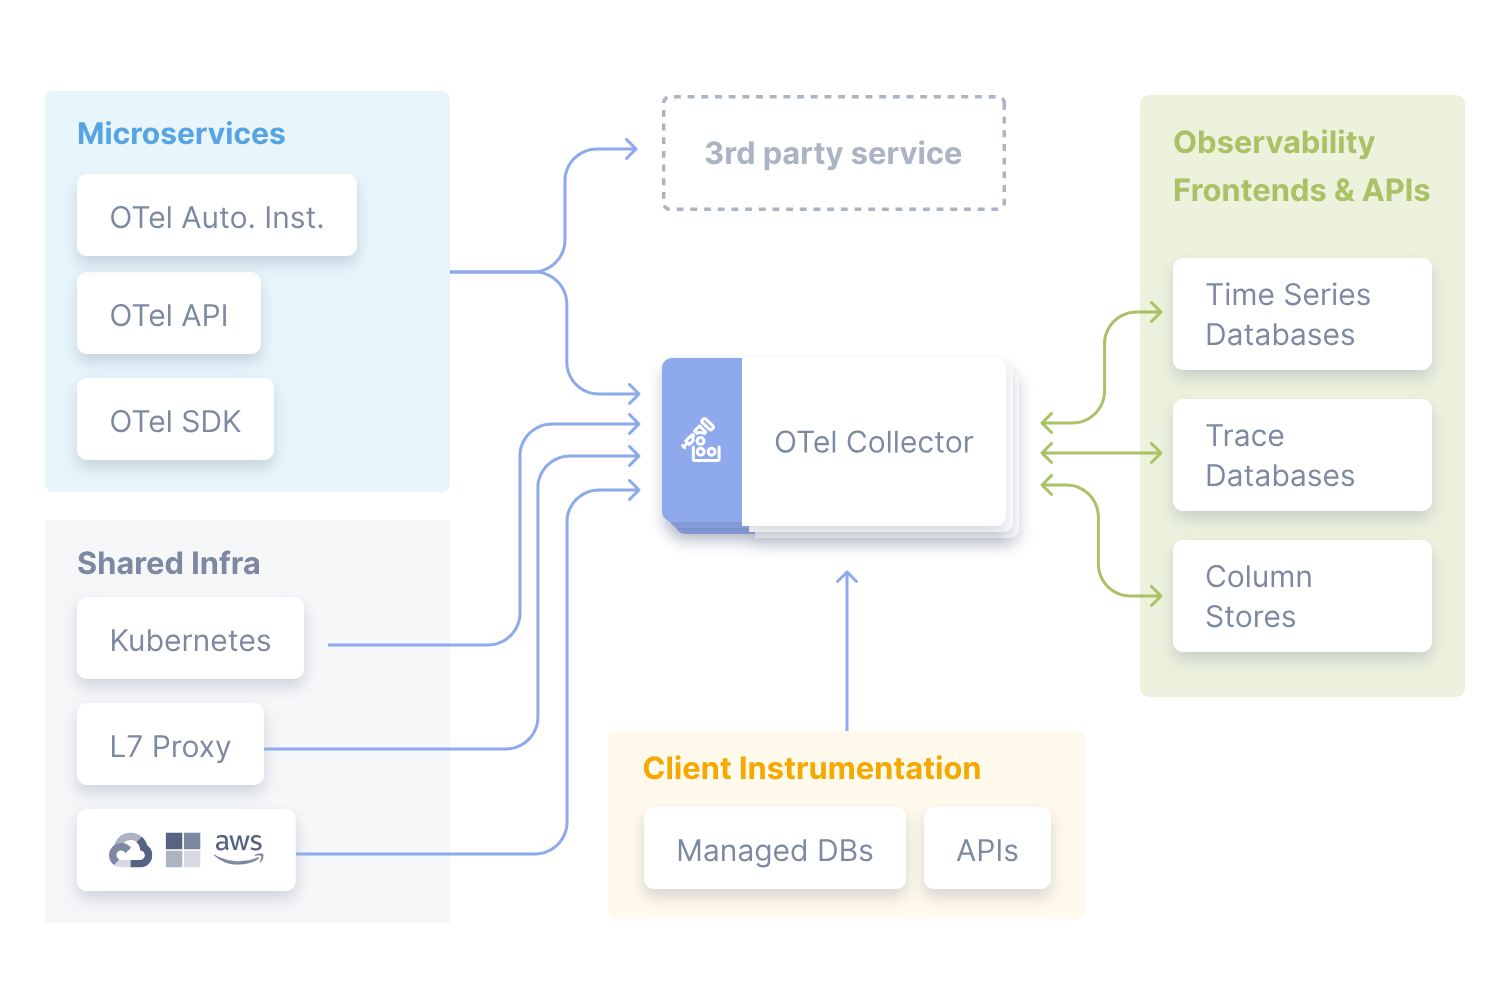
Collector: The collector is responsible for receiving, processing, and exporting telemetry data. While it’s not a mandatory component, it significantly enhances the OpenTelemetry architecture by offering more flexibility in terms of how telemetry data is received and routed to backends.
The collector can be deployed in two main ways:
-
Agent Mode: Runs on the same host as the application (e.g., as an executable, DaemonSet, or sidecar).
-
Standalone Mode: Runs as a separate process independent of the application.
Though the collector facilitates telemetry data collection and transmission, it still requires a third-party backend to receive, store, and analyze the data.
The benefits of OpenTelemetry
Collecting and analyzing application data isn’t new. But the methods and formats used can vary wildly between applications and backends. This inconsistency creates challenges for developers and SREs who need a clear view of an application’s health.
By standardizing how this data is generated and shared, OpenTelemetry offers several compelling benefits for developers, IT operations, and business stakeholders:
-
Unified Observability. OpenTelemetry unifies the process of collecting telemetry data within a single framework. This eliminates the need for disparate tools and custom integrations, providing a cohesive observability strategy and simplifies debugging and performance monitoring.
-
Vendor-Neutral Instrumentation. The framework is designed to be vendor-agnostic, allowing organizations to avoid vendor lock-in. OpenTelemetry supports integration with a wide variety of observability tools (e.g., Prometheus, Grafana, Jaeger, Elastic, Datadog), enabling businesses to choose or switch tools without re-instrumenting applications.
-
Cost Efficiency. Standardized instrumentation means organizations spend less time building and maintaining custom telemetry solutions. By leveraging the open-source community and out-of-the-box libraries provided by OpenTelemetry, teams can save on development and operational costs while improving coverage and consistency.
-
Improved Debugging and Monitoring. With unified traces, metrics, and logs collection it allows developers to gain deeper insights into application performance and behavior. Correlating these data types helps pinpoint bottlenecks, errors, or performance degradations more effectively, enabling faster root-cause analysis and resolution.
-
Scalability. The framework is designed for modern systems such as based on microservices and cloud-native architectures, so it can handle high-throughput environments to provide insights across complex, distributed applications.
-
Cross-Language Support. OpenTelemetry supports instrumentation for multiple programming languages, including Java, Python, JavaScript, C#, Go, and Ruby, among others. This broad compatibility allows teams to implement observability across their stack consistently.
-
Future-Proof. Business requirements and applications evolve rapidly, making it essential to choose a durable technology for observability. OpenTelemetry, as an open-source, community-driven project, adapts to industry trends and needs. This adaptability ensures compatibility with new technologies and observability standards, positioning it as a future-proof solution for organizations embracing modern development practices.
-
Simplified Adoption of Cloud-Native Standards. OpenTelemetry is part of the Cloud Native Computing Foundation (CNCF) ecosystem, aligning it with other popular tools like Kubernetes, Prometheus, and Fluentd. This ensures seamless integration and adherence to best practices for monitoring and observability in cloud-native environments.
-
Enhanced Business Outcomes. By providing reliable and actionable insights into application performance, OpenTelemetry helps improve user experience and system reliability. It enables proactive identification of issues before they impact customers, boosting trust and satisfaction.
-
Community and Ecosystem Support. OpenTelemetry is backed by a thriving community of contributors, major tech companies, and observability platforms. This robust ecosystem ensures continuous improvements, wide-ranging integrations, and access to community expertise for troubleshooting or scaling observability efforts.
While migrating to an OpenTelemetry-enabled technology stack presents challenges - such as the time required for transition and the need to manage systems and logs that lack native OpenTelemetry support, like those from security or network equipment - the benefits of migration far outweigh these drawbacks.
OpenTelemetry enhances observability, streamlines monitoring across diverse systems, and fosters greater operational efficiency, making it a valuable investment despite the need to accommodate some legacy and specialized systems. Its standardization, flexibility, and scalability make it a vital tool for achieving deeper insights into system behavior, ensuring performance optimization, and enabling seamless collaboration across teams and tools.
How NXLog maps onto the OpenTelemetry world
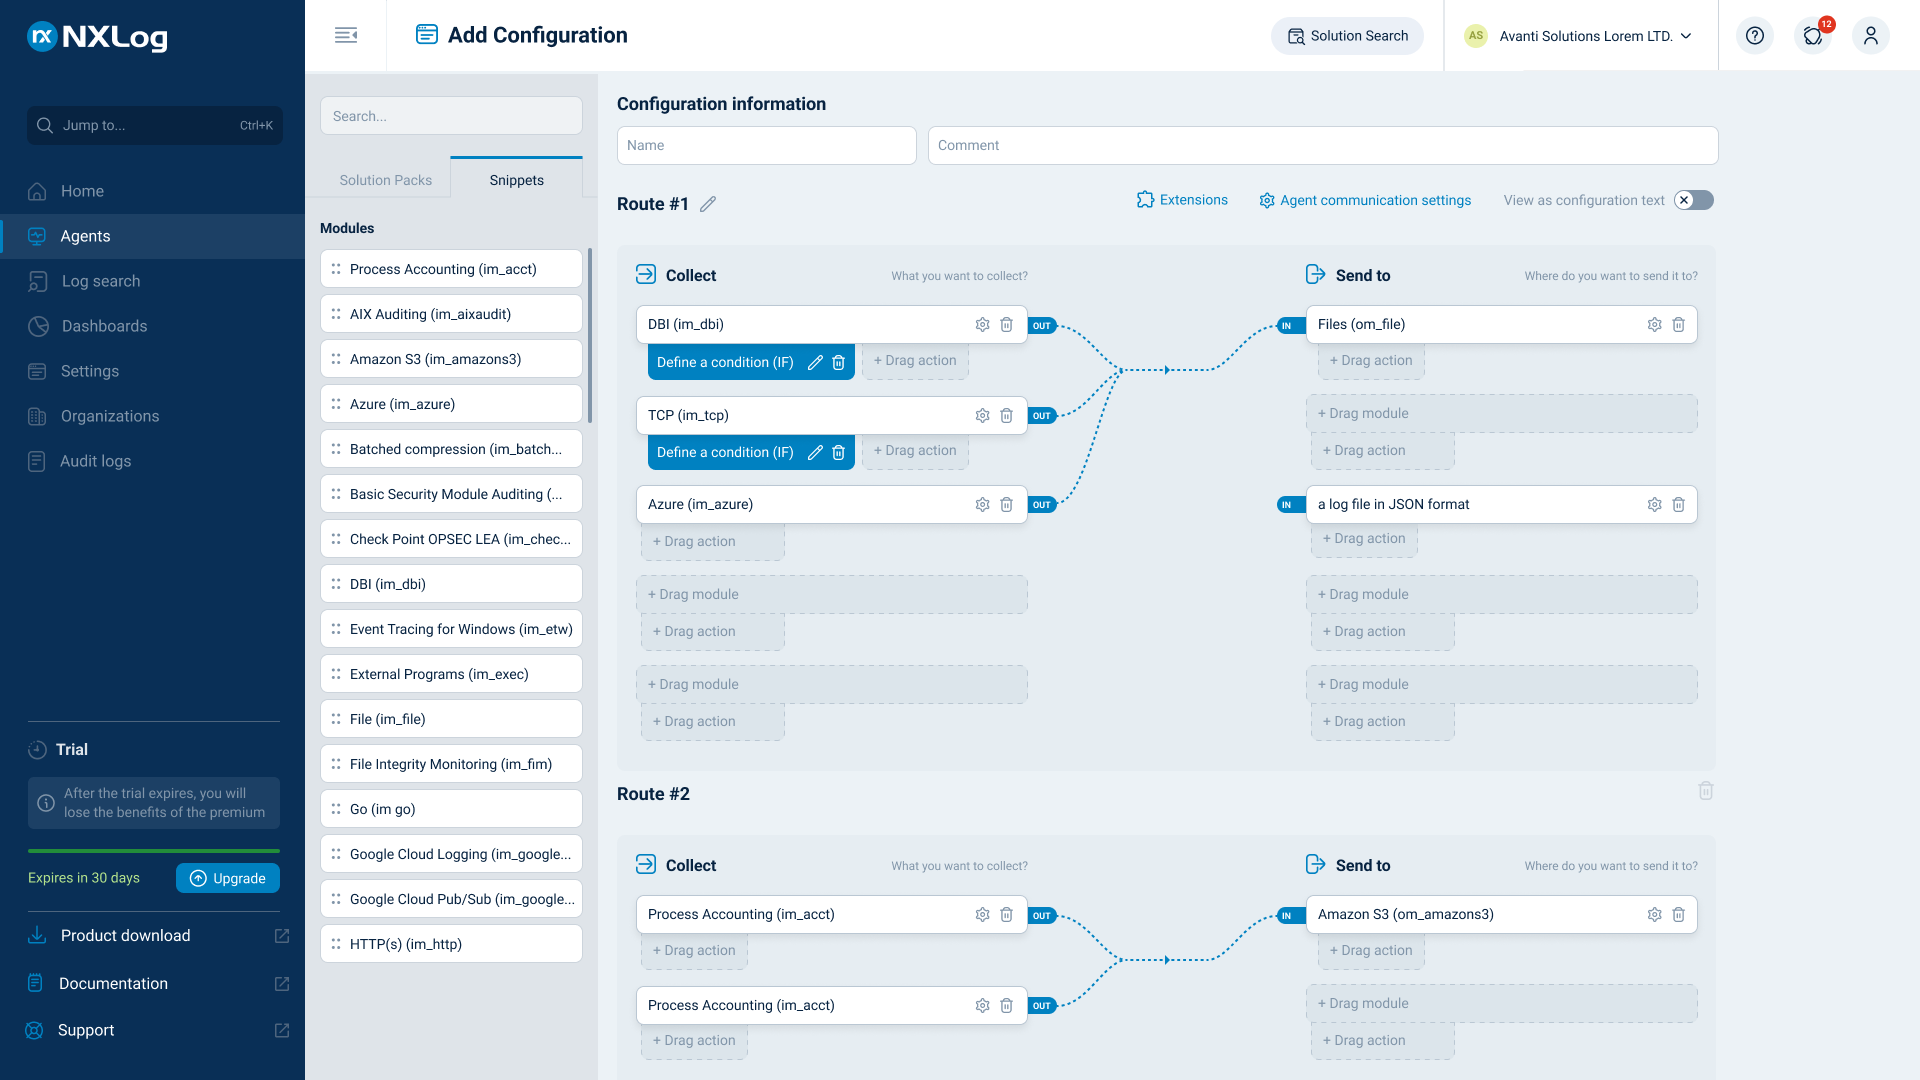
NXLog Platform is a professional, unified log management solution for end-to-end IT and security observability. NXLog Platform gives you the data storage and analysis data backend, while heavily extending native OpenTelemetry collector capabilities with its NXLog Agent features available with the OpenTelemetry Collector (im_otel) module.
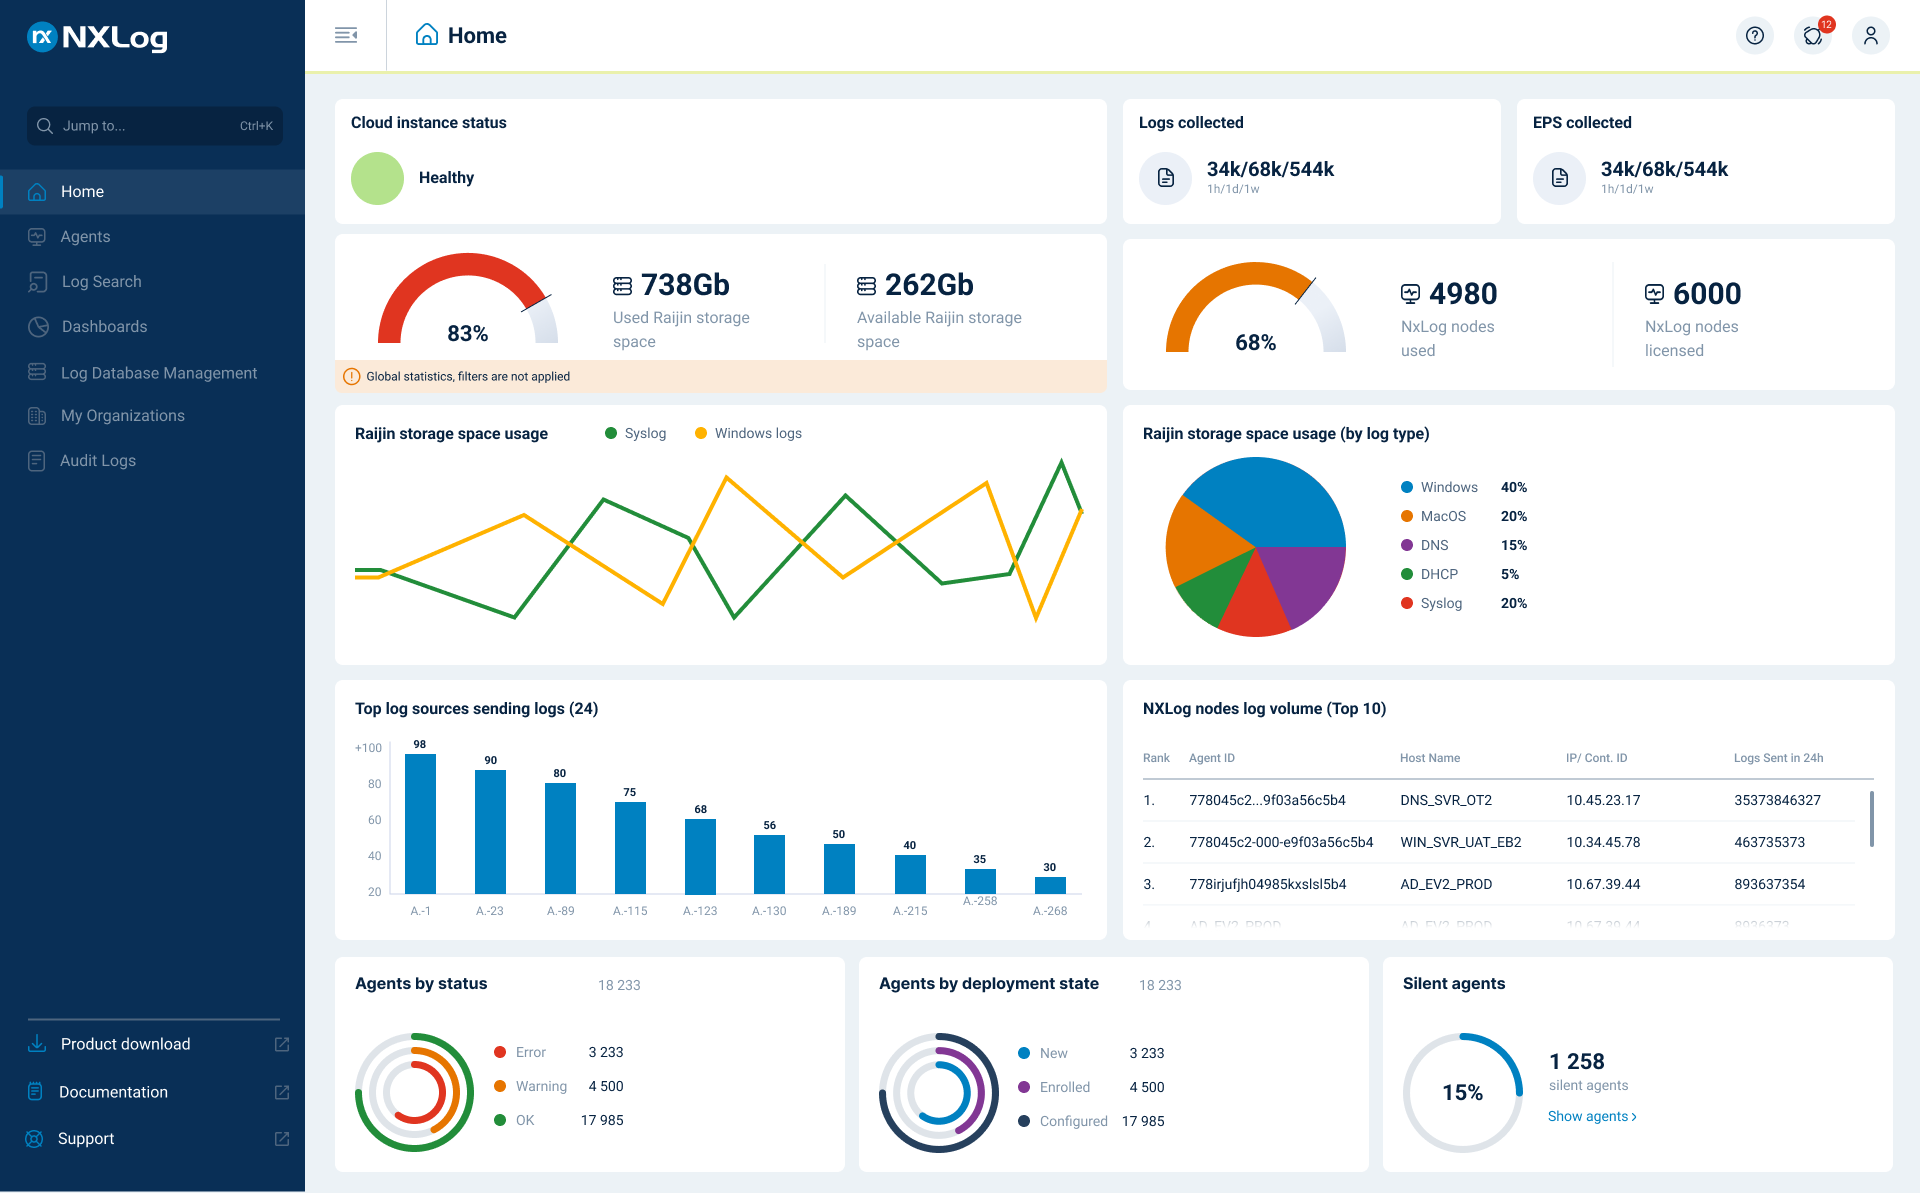
With NXLog Platform you can run a single agent to capture every piece of data across your infrastructure – via OpenTelemetry, plain text files, network sockets, databases, and anything else you can imagine.
Tell our experts about your specific use case, and we’ll find the best-fit solution for you!