
In this post, the technology we will be examining is the Azure Monitor HTTP Data Collector API, which enables clients, such as the NXLog agent, to send events to a Log Analytics workspace, making them directly accessible using Microsoft Sentinel queries.
We will present two examples of sending logs to Microsoft Sentinel: in the first one, we send Windows DNS Server logs and in the second one, Linux kernel audit logs. Both of these log sources are of interest from a security perspective.
Proactive monitoring of DNS activity can help network administrators quickly detect and respond to attempted security breaches in DNS implementations that might otherwise lead to data theft, denial-of-service, or other service disruptions related to malicious activity.
In comparison, Linux Audit has a much wider scope and could arguably be called the most comprehensive tool for monitoring and reporting security events on Linux distributions.
Collecting DNS Server logs via Windows Event Tracing
Event Tracing for Windows (ETW) provides not only efficient logging of both kernel and user-mode applications but also access to the Debug and Analytical channels that are not available through Windows Event Log channels (which also contains some DNS Server logs).
Authentication
The pivotal part of sending secure HTTPS requests to Azure is the
authentication process. Azure validates the values of two custom HTTP headers,
Authorization and x-ms-date along with the length of the data payload to
determine if the request is authentic. The value assigned to the
Authorization header is dynamically generated using a cryptographic hash. For
details, see the Azure Monitor Authorization section in the Microsoft documentation.
Capturing ETW events - The input side
NXLog can natively collect ETW logs without the need to capture the trace into
an .etl file. Configuring an NXLog agent to capture Windows DNS Server events
using the
Event Tracing for Windows (im_etw) input module is fairly straightforward as illustrated here:
<Extension _json>
    Module      xm_json
</Extension>

<Input DNS_Logs>
    Module      im_etw
    Provider    Microsoft-Windows-DNSServer
    <Exec>
                to_json();
                $Table = "DNS_Logs";
    </Exec>
</Input>
The Exec statement of the DNS_Logs input instance
above invokes the to_json() procedure, which
converts the Windows events to JSON records, as required by Azure’s
HTTP Data Collector API.
Additionally, the Table variable is defined which allows for multiple inputs to
be defined with their own table name while pointing towards a single output
instance.
Sending ETW events - The output side
The output module is the part that connects directly to Azure. The first step in configuring the output instance is retrieving the Workspace ID and either the Primary key or the Secondary key (also referred to as the shared key). These keys can be found by navigating in the Azure portal to Log Analytics workspace > Settings > Agents management. The same set of keys can be viewed under either the Windows servers or Linux servers tab.
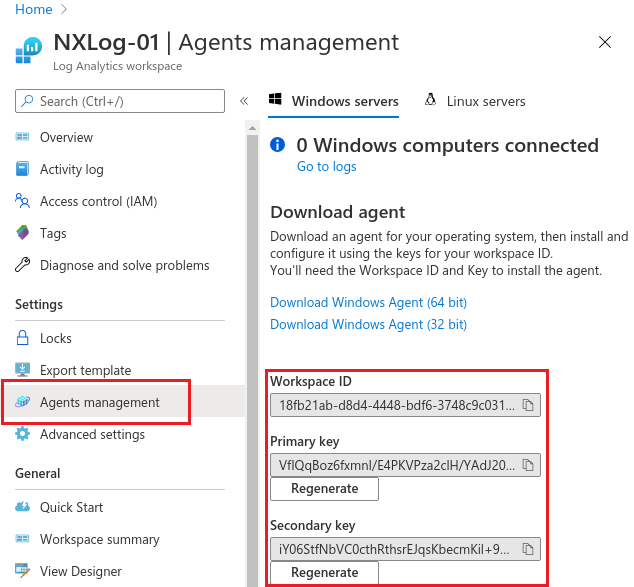
The next step is to add this information to the nxlog.conf file as
constants
making them accessible to the output instance.
The SUBDOMAIN, RESOURCE, and APIVER are used to construct the complete
URL. The value for SIZELIMIT can be tuned to your needs. It represents the
maximum size in bytes of the data payload for each batch of events. 65000 is
the upper limit. The higher values mean better network efficiency. Lower values
mean events can be received faster because they are not waiting for a large
buffer to be full before they can be sent.
define WORKSPACE        18fb21ab-d8d4-4448-bdf6-3748c9c03135
define SHAREDKEY        VfIQqBoz6fxmnI/E4PKVPza2clH/YAdJ20RnCDwzHCqCMnobYdM1/dD1+KJ6cI6AkR4xPJlTIWI/jfwPU6QHmw==
define SUBDOMAIN        ods.opinsights.azure.com
define RESOURCE         api/logs
define APIVER           api-version=2016-04-01
define SIZELIMIT        65000
When looking at the entire output instance that uses the Microsoft Sentinel (om_azure) module, you can see how batches of events are buffered and then flushed:
<Output Azure>
    Module                 om_azure
    URL                    https://%WORKSPACE%.%SUBDOMAIN%/%RESOURCE%?%APIVER%
    WorkspaceID            %WORKSPACE%
    SharedKey              %SHAREDKEY%
    TableName              $Table
    HTTPSCAFile            %INSTALLDIR%\cert\ca-certificates.crt
</Output>

<Route DNS_Logs_Route>
    Path                   DNS_Logs => Azure
</Route>
Since all REST API events are categorized by Azure Monitor as Custom Logs,
Azure appends _CL to the value of TableName in order to prevent naming
conflicts with other Azure tables thus the name we originally chose,
DNS_Logs, appears in Microsoft Sentinel as DNS_Logs_CL.
Configuration checklist
To prepare for testing, let’s run through the steps needed to ensure success:
-
Download/view the entire nxlog.conf configuration file and append its contents to your current
C:\Program Files\nxlog\conf\nxlog.confNXLog configuration file. -
Ensure that you have changed the values of
WORKSPACEandSHAREDKEYto match those of your Log Analytics workspace as well as defining theTablevariable in yourInputsection.
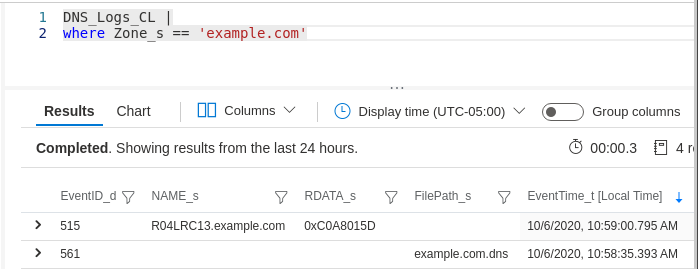
To test DNS Server logging of audit events, we added an A record for
R04LRC13.example.com and reloaded the example.com zone. This
logs an event with EventID 515 (Record Create) and another one with
EventID 561 (Zone Reload).
Now it’s time to log into the Azure Log Analytics workspace that was defined in
the DNS_Logs output instance and open Logs. After expanding
Custom Logs the DNS_Logs_CL should be visible. With a simple query,
the newly ingested events are visible.
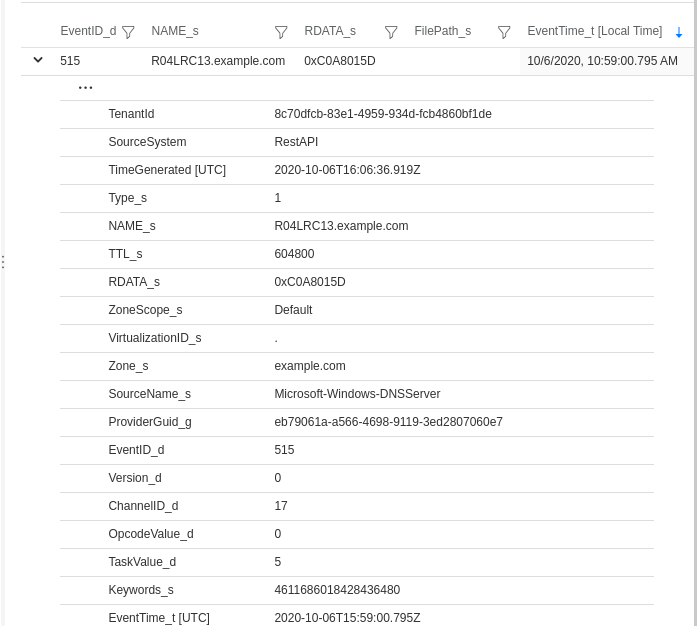
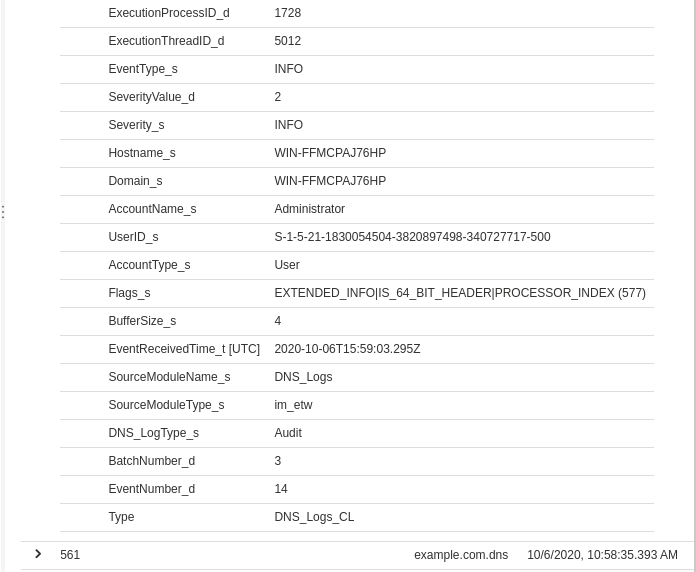
Expanding the first event’s details shows the complete set of fields and their values:
For testing purposes, you may want to add a temporary output instance for
validating the integrity of your configuration. This lets you compare the
events and their fields with what Microsoft Sentinel is ingesting. As you can see
here, by adding a new output instance named TempFile as an additional
destination to the route, this allows you to view the events in JSON format that
will be stored in the file defined by the File directive.
<Output TempFile>
    Module    om_file
    File      'C:\Program Files\nxlog\data\dnsetw.json'
</Output>

<Route DnsRoute1>
    Path      DNS_Logs => Azure, TempFile
</Route>{
"SourceName": "Microsoft-Windows-DNSServer",
"ProviderGuid": "{EB79061A-A566-4698-9119-3ED2807060E7}",
"Channel": "Microsoft-Windows-DNS-Server/Analytical ",
"Category": "LOOK_UP ",
"EventID": 257,
"Version": 0,
"ChannelID": 16,
"OpcodeValue": 0,
"TaskValue": 1,
"Keywords": "9223372036854775810",
"EventTime": "2022-02-16T12:03:08.244340-08:00",
"ExecutionProcessID": 1432,
"ExecutionThreadID": 2220,
"EventType": "INFO",
"SeverityValue": 2,
"Severity": "INFO",
"Hostname": "WIN-H1ICAKR5GAA",
"Domain": "NT AUTHORITY",
"AccountName": "SYSTEM",
"UserID": "S-1-5-18",
"AccountType": "User",
"Flags": "33152",
"TCP": "0",
"InterfaceIP": "127.0.0.1",
"Destination": "127.0.0.1",
"AA": "0",
"AD": "0",
"QNAME": "cc6247e7-6230-44cd-84fb-819413026e8b.ods.opinsights.azure.com.",
"QTYPE": "1",
"XID": "11165",
"DNSSEC": "0",
"RCODE": "0",
"Port": "49893",
"Scope": "Default",
"Zone": "..Cache",
"BufferSize": "174",
"PacketData": "0x2B9D818000010003000000002463633632343765372D363233302D343463642D383466622D383139343133303236653862036F64730A6F70696E73696768747305617A75726503636F6D0000010001C00C00050001000000B2001F0A7775732D6F692D6F64730E747261666669636D616E61676572036E657400C05B000500010000000700180C7775732D6F692D6F64732D6108636C6F7564617070C075C086000100010000000800040D56DAE3",
"EventReceivedTime": "2022-02-16T12:03:10.213097-08:00",
"SourceModuleName": "DNS_Logs",
"SourceModuleType": "im_etw",
"DNS_LogType": "Analytical"
}Troubleshooting
If you are unable to see any events arriving in your Microsoft Sentinel table, try these troubleshooting steps:
-
Look at the NXLog internal log file for clues which is located in
C:\Program Files\nxlog\data\nxlog.logon Windows. Success should look like this:
2022-02-15 13:33:32 INFO [CORE|main] nxlog-5.4.7313 started on Windows
2022-02-15 13:33:32 INFO [om_azure|azure] connecting to 18fb21ab-d8d4-4448-bdf6-3748c9c03135.ods.opinsights.azure.com(13.86.218.227):443
2022-02-15 13:33:32 INFO [om_azure|azure] successfully connected to 18fb21ab-d8d4-4448-bdf6-3748c9c03135.ods.opinsights.azure.com(13.86.218.227):443
2022-02-15 13:37:41 INFO [om_azure|azure] reconnecting to 18fb21ab-d8d4-4448-bdf6-3748c9c03135.ods.opinsights.azure.com(13.86.218.227):443 (last connection attempt was 248 sec ago)
2022-02-15 13:37:41 INFO [om_azure|azure] connecting to 18fb21ab-d8d4-4448-bdf6-3748c9c03135.ods.opinsights.azure.com(13.86.218.227):443
2022-02-15 13:37:41 INFO [om_azure|azure] successfully connected to 18fb21ab-d8d4-4448-bdf6-3748c9c03135.ods.opinsights.azure.com(13.86.218.227):443-
For missing data or errors please refer to
C:\Program Files\nxlog\data\nxlog.logand observe any conditions such as theWORKSPACEkey being incorrect. -
Make sure the input instance is correctly configured and that events are actually being captured by adding an additional output instance for logging them to a local temporary file as demonstrated above.
Including DNS Server analytical logs captured with ETW
If analytical event logging is enabled, you can capture and view DNS Sever analytical events having EventIDs ranging from 256 to 286. Technically, no further changes are needed for logging and viewing both audit and analytical events in Azure Sentinel. However, there is one enhancement you might want to implement:
Enrich the schema with a new attribute: DNS_LogType. If you need to
frequently differentiate between audit and analytical DNS Server events,
querying for a range of values on a regular basis is not only tedious and makes
queries less readable, but it can also be slower on large data sets. This is as
simple as replacing the original Exec to_json(); with an Exec block that
sets the new $DNS_LogType field to either Audit or Analytical depending
on the value of EventID before calling the to_json() which will then enrich
the schema with this new field.
<Input DNS_Logs>
    Module      im_etw
    Provider    Microsoft-Windows-DNSServer
    <Exec>
        if $EventID >= 256 and $EventID <= 286 $DNS_LogType = 'Analytical';
        if $EventID >= 512 and $EventID <= 596 $DNS_LogType = 'Audit';
        to_json();
        $Table = "DNS_Logs";
    </Exec>
</Input>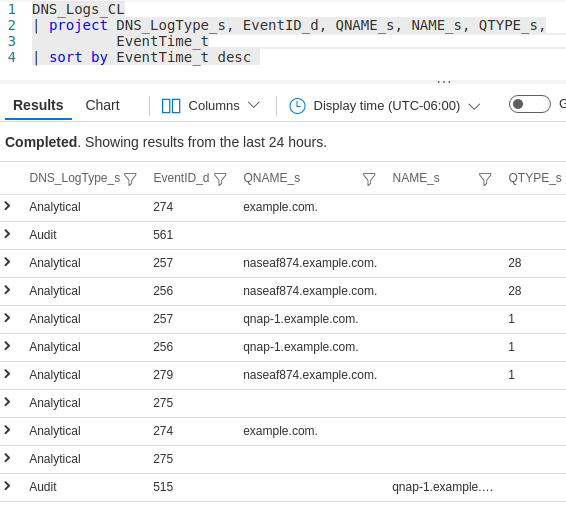
Download/view the entire nxlog.conf configuration file.
Collecting Linux Audit logs
In this section we examine Linux Audit logs and how they can be sent to Microsoft Sentinel. Since the prerequisites of data format (JSON), transport (HTTPS REST API with some special headers), and authentication (single-use cryptographic hash) are the same for sending Linux log sources to Azure Sentinel, we are now free to focus on the log source itself and the minor differences between a Windows deployment and a Linux deployment.
The Linux Audit system provides fine-grained logging of security related
events. These logs can also provide a wealth of security information:
changes to DNS zone files, system shutdowns, attempts to access unauthorized
files, and other suspicious activity. NXLog includes the im_linuxaudit
module for directly accessing the kernel component of the Audit System. With
this module, NXLog can be configured to build Audit rules and collect logs
without requiring auditd or any other user-space software.
Capturing Linux Audit events - The input side
Let’s take a look at the configuration file to see how the input module is configured and how the rules are defined.
<Extension _resolver>
    Module           xm_resolver
</Extension>

<Input LinuxAudit>
    Module           im_linuxaudit
    FlowControl      FALSE
    LoadRule         %INSTALLDIR%/etc/im_linuxaudit.rules
    ResolveValues    TRUE
    <Exec>
                     to_json();
                     $Table = "LinuxAudit";
    </Exec>
</Input>
Instead of defining a small set of audit rules within a Rules block directly in the LinuxAudit input instance, we use the LoadRule directive to load a more comprehensive collection of rules in an audit rule file which is based on the ruleset maintained by the Best Practice Auditd Configuration project.
The xm_resolver module
is needed for the ResolveValues directive in the audit input instance, where
it is used for resolving some of the numeric values to more human-readable
string values.
Sending Linux Audit events - The output side
As with the Windows example, ensure that the required values are properly
configured and proceed to name the Table accordingly, in our case we are using
LinuxAudit as the name.
<Output Azure>
    Module              om_azure
    URL                 https://%WORKSPACE%.%SUBDOMAIN%/%RESOURCE%?%APIVER%
    WorkspaceID         %WORKSPACE%
    SharedKey           %SHAREDKEY%
    TableName           $Table
    HTTPSCAFile         /etc/ssl/certs/ca-certificates.crt
</Output>
Download/view the nxlog.conf configuration file.
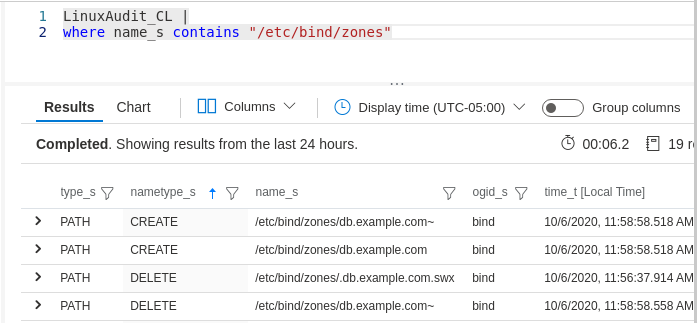
Once these changes have been implemented and the NXLog service has been
restarted, events should be sent to the LinuxAudit_CL Microsoft Sentinel table.
The following JSON event was triggered and captured according to the very last
line in the im_linuxaudit.rules file.
{
"type": "PATH",
"time": "2022-02-16T14:37:59.760000-08:00",
"seq": 347,
"item": 0,
"name": "/usr/sbin/ifconfig",
"inode": 925926,
"dev": "08:01",
"mode": "file,755",
"ouid": "root",
"ogid": "root",
"rdev": 0,
"nametype": "NORMAL",
"cap_fp": 0,
"cap_fi": 0,
"cap_fe": 0,
"cap_fver": 0,
"Hostname": "debian-10-main",
"EventReceivedTime": "2022-02-16T14:37:59.764419-08:00",
"SourceModuleName": "LinuxAudit",
"SourceModuleType": "im_linuxaudit"
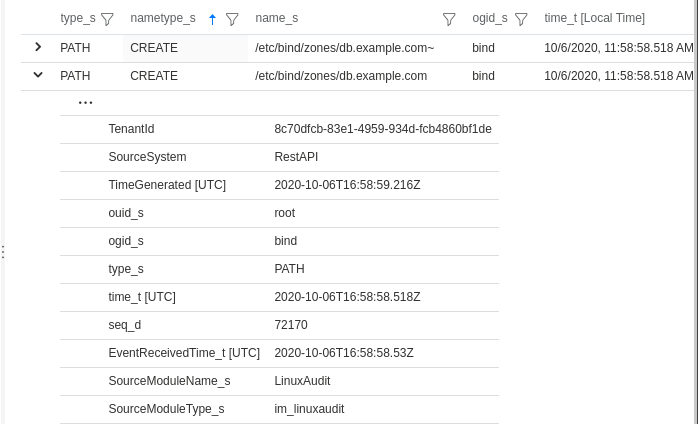
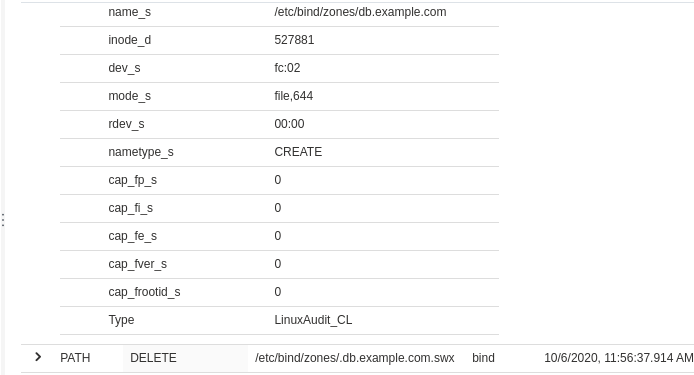
}Upon successful receipt in the Log Analytics workspace by Azure Monitor, events are further processed and finally ingested by Microsoft Sentinel where they can be viewed via user-defined queries.
After expanding the following event to reveal its columns and their values, it can be verified against the JSON formatted event above that was sent via the REST API.
Summary
Given the configuration samples and use cases presented here, you should now possess the basic information needed to benefit from these additional security monitoring opportunities in your own enterprise. To recap, the main advantages are:
-
Event Tracing for Windows (ETW) offers better performance because it doesn’t need to capture the trace into an .etl file and provides access to Debug and Analytical channels
-
The native NXLog Linux Audit input module that works out of the box without the need to install
auditdand when coupled with the NXLog Resolver extension module can resolve IP addresses as well as group/user IDs to their respective names, making Linux audit logs more intelligible to security analysts -
A general-purpose output configuration enabling Microsoft Sentinel to ingest events from multiple, diverse log sources simultaneously, from any host in your enterprise having outbound access to Azure