
Modbus is a simple and flexible protocol used by a wide variety of industrial and automation equipment. Its simplicity has made it attractive for many manufacturers, but it also poses a number of challenges in terms of security and traffic analysis. In this post, we’ll show you how to use NXLog to capture, process, and extract useful security information from Modbus traffic.
What makes Modbus traffic analysis challenging?
Modbus is a low-level protocol that effectively uses only two data types: bits (in the form of coils), and 16-bit words (in the form of registers), which are also the only form of data that can be natively addressed with most devices. Other data types are effectively piggy-backed on top of these two data types, in whatever fashion each manufacturer finds most convenient. Thus, even extracting simple application data — such as sensor readings or application requests — out of individual packets requires some post-processing effort, which is often device-specific.
The Modbus protocol also has a number of quirks that can make interaction between devices more difficult to analyze. For example, error responses contain very little information besides the error code itself, and even that is not very informative. Extracting high-level application traffic data often requires correlating data from multiple packets.
NXLog offers several ways to handle and analyze this kind of traffic. The approach that we will explore today will:
Modbus traffic analysis: an illustrated example
In order to illustrate traffic collection and analysis, let us consider a simple process controller device which supervises a temperature-driven process and can emit temperature alerts as soon as the monitored temperature is no longer within a safe range.
This device exposes temperature readings via register 0x04. Reading
that register will return the current temperature reading as an
unsigned integer in tenths of a degree. For example, a temperature
of 38.9 degrees Celsius will be read as 389. Two temperature alert
thresholds — a low threshold and a high threshold — can be read
and written from/to registers 0x00 and 0x01. The alert mode
(disabled, high, low, high/low) can be read and written from/to register
0x02.
In order to modify the temperature threshold, a specific passphrase needs
to be written using the Write Multiple Registers command starting at address
0x1F. Writing the wrong passphrase will trigger an exception response,
whereas writing the correct passphrase will just trigger a regular Write
Multiple Registers confirmation response. The Write Multiple Registers
error response does not include the register address or word count of
the request that triggered it, but it can be matched to the original
request via the transaction ID field.
Most Modbus devices do not natively support encrypted communication, so this is more of a safety feature to guard against accidental writes than a reliable authentication and authorization feature. However, failed "login" attempts and unauthorized temperature threshold modification attempts are typical signs of low-effort, automated attacks.
As an exercise, we will configure NXLog to detect failed login attempts and log them to a Microsoft Azure Sentinel custom table, which can be used by Azure Sentinel or any other SIEM with a log analytics backend.
We will use im_pcap to capture Modbus traffic and a small post-processing routine written in Python that is called using xm_python, to detect failed login attempts. The script will tag security-relevant packets that we will use to build a security alert, which we will then post to Azure Sentinel using om_azure.
Detecting failed login attempts
Let’s start with a simple prototype that will analyze Modbus traffic and
detect failed login attempts. This first version will not issue any alerts
to a cloud system. It will only detect failed logins, tag exception
responses triggered by bad passphrases with a SecurityAlert field, and
add a SecurityDetails field that includes a relevant subset of the
original request data.
Capturing traffic
Before we get to the logic for capturing traffic, let’s start with a simple configuration that captures only Modbus traffic and outputs it to a file. Later on, we will extend it to detect failed login attempts, and then to add an entry to a custom Azure Sentinel table.
Our minimal configuration file defines instances using three modules: im_pcap, which it uses to capture data (from a PCAP file, in our example, but this can also be done in real-time, capturing from a physical or virtual device), om_file, which it uses to output data to a local file, and xm_json, which it uses to convert im_pcap data to JSON format.
Outputting to a local log file makes it easy to inspect our post-processed data. The Azure Log Analytics API is fairly picky in terms of data format, so being able to inspect it locally is helpful during development.
Without further ado, this is our minimal configuration:
include common.conf
<Extension _json>
Module xm_json
</Extension>
<Input pcap>
Module im_pcap
File '%DATADIR%/badlogin.pcap'
</Input>
<Output file>
Module om_file
File '%DATADIR%/badlogin.out'
Exec to_json();
</Output>
<Route in_file_to_out>
Path pcap => file
</Route>This is enough to get a JSON-formatted dump of the raw Modbus
traffic in badlogin.out. Now, let us extend our minimal monitoring
infrastructure to detect failed login attempts.
Detection logic
Entering the passphrase is done by issuing a Write Multiple Registers
(16) request. The payload of this message contains the address of the
register, the passphrase, and its length. If authentication is
successful, a Write Multiple Registers echoes back the address and the
word count.
{
"ipv4.dst": "10.0.2.24",
"ipv4.src": "10.0.2.15",
"modbus.function_code": "Write Multiple Registers (16)",
"modbus.length": "39",
"modbus.prot_id": "0",
"modbus.query.write_multiple_registers.byte_count": "32",
"modbus.query.write_multiple_registers.qty_of_regs": "16",
"modbus.query.write_multiple_registers.registers": "97, 98, 64, 100, 112, 64, 115, 115, 119, 111, 114, 100, 49, 50, 51, 52",
"modbus.query.write_multiple_registers.starting_address": "31",
"modbus.trans_id": "10",
"modbus.unit_id": "0",
"tcp.dst_port": "502",
"tcp.flag": "[ACK]",
"tcp.src_port": "52701",
"EventTime": "2020-09-23T11:54:35.978990+03:00",
"EventReceivedTime": "2020-09-23T14:32:40.532303+03:00",
"SourceModuleName": "pcap",
"SourceModuleType": "im_pcap",
"login": "true"
}
{
"ipv4.dst": "10.0.2.15",
"ipv4.src": "10.0.2.24",
"modbus.function_code": "Write Multiple Registers (16)",
"modbus.length": "6",
"modbus.prot_id": "0",
"modbus.response.write_multiple_registers.qty_of_regs": "16",
"modbus.response.write_multiple_registers.starting_address": "31",
"modbus.trans_id": "10",
"modbus.unit_id": "0",
"tcp.dst_port": "52701",
"tcp.flag": "[ACK]",
"tcp.src_port": "502",
"EventTime": "2020-09-23T11:54:35.979503+03:00",
"EventReceivedTime": "2020-09-23T14:32:40.532322+03:00",
"SourceModuleName": "pcap",
"SourceModuleType": "im_pcap"
}A failed login attempt, on the other hand, causes the other host to
reply with a Write Multiple Registers Error (0x90) message. This is what
a failed login attempt looks like:
{
"ipv4.dst": "10.0.2.24",
"ipv4.src": "10.0.2.15",
"modbus.function_code": "Write Multiple Registers (16)",
"modbus.length": "19",
"modbus.prot_id": "0",
"modbus.query.write_multiple_registers.byte_count": "12",
"modbus.query.write_multiple_registers.qty_of_regs": "6",
"modbus.query.write_multiple_registers.registers": "97, 98, 99, 100, 101, 102",
"modbus.query.write_multiple_registers.starting_address": "31",
"modbus.trans_id": "7",
"modbus.unit_id": "10",
"tcp.dst_port": "502",
"tcp.flag": "[ACK]",
"tcp.src_port": "39565",
"EventTime": "2020-09-23T12:02:13.754660+03:00",
"EventReceivedTime": "2020-09-24T14:46:17.780007+03:00",
"SourceModuleName": "pcap",
"SourceModuleType": "im_pcap"
}
{
"ipv4.dst": "10.0.2.15",
"ipv4.src": "10.0.2.24",
"modbus.function_code": "Write Multiple Registers Error (0x90)",
"modbus.length": "3",
"modbus.prot_id": "0",
"modbus.response.write_multiple_registers.exc_code": "Illegal Data Address (02)",
"modbus.trans_id": "7",
"modbus.unit_id": "10",
"tcp.dst_port": "39565",
"tcp.flag": "[ACK]",
"tcp.src_port": "502",
"EventTime": "2020-09-23T12:02:13.755086+03:00",
"EventReceivedTime": "2020-09-24T14:46:17.780027+03:00",
"SourceModuleName": "pcap",
"SourceModuleType": "im_pcap"
}Note that the error packet only includes the error type, not the
address of the original request. This, of course, poses an interesting
problem: since writing to any register can cause a
Write Multiple Registers Error message, how do we isolate those that
result from writing a bad passphrase?
Modbus does lend us a helping hand in the form of the transaction ID field. Each Modbus request that the master issues has a 16-bit transaction ID which the slave will use as the transaction ID of its reply.
All we have to do then, is save a copy of Write Multiple Registers requests to a local packet queue. When we get the a response — either a confirmation or an error packet — we retrieve the corresponding request from the queue. We don’t need to do anything with the original request if the response is a confirmation message, we just drop the original requests from the queue. However, if we get an error message, we can use the original request to retrieve the register address, which enables us to isolate the error messages corresponding to login attempts.
Matching via transaction IDs does present a small complication: transaction IDs are not per-device, they are per-TCP connection. This means that, at a minimum, we should match not only the transaction ID, but also the IP address of the device at the other end of the wire. More advanced setups will need more advanced matching rules, but in our case, matching the transaction ID and the IP address will be good enough.
NXLog configuration
We will implement this pretty simple logic in Python and invoke it using
the
xm_python
module. The entry point will be a function called modbus_postproc,
which we’ll take a closer look at shortly. All we need to do in order to invoke
it is add an
xm_python
instance:
<Extension pyxm>
    Module      xm_python
    PythonCode  %SCRIPTDIR%/postproc.py
</Extension>
and then call our function in an Exec block in the output module
instance:
<Output file>
    Module      om_file
    File        '%DATADIR%/badlogin.out'
    <Exec>
        pyxm->call("modbus_postproc");
        to_json();
    </Exec>
</Output>
Python implementation
Our post-processing code consists of just under 100 lines of code. Python
integration using
xm_python
is very straightforward: from within an Exec block, call the Python
function you defined in the a Python source file which you specify in the
xm_python
instance’s configuration. That function receives an NXLog event record
as its sole argument. That grants you access to every logged packet
field via the event instance’s get_field() method.
Here we see the Python code containing the post-processing logic that was
loaded via the PythonCode directive in the pyxm instance:
import json
import requests
import datetime
import hashlib
import hmac
import base64

import nxlog

DEV_PWD_REG_ADDR = "31"

def get_matching_query(module, trans_id, ip_src):
    if not 'modbus_msg_queue' in module:
        module['modbus_msg_queue'] = []

    for i in range(len(module['modbus_msg_queue'])):
        if (module['modbus_msg_queue'][i]["modbus.trans_id"] == trans_id) and \
           (module['modbus_msg_queue'][i]["ipv4.dst"] == ip_src):
            ev = module['modbus_msg_queue'].pop(i)
            return ev

    return None

# Analyze a packet and tag it with a "security" field. Packets that are
# tagged will get sent to the SIEM.
def modbus_postproc(event):
    mb_func = event.get_field('modbus.function_code')

    if mb_func == "Write Multiple Registers (16)":
        mb_query_addr = event.get_field("modbus.query.write_multiple_registers.starting_address")
        mb_resp_addr = event.get_field("modbus.resp.write_multiple_registers.starting_address")

        if mb_query_addr == DEV_PWD_REG_ADDR:
            module = event.module

            # Save a copy of this event so that we can match it against possible exceptions via the transaction ID
            if not 'modbus_msg_queue' in module:
                module['modbus_msg_queue'] = []

            ev_summary = dict([('ipv4.src', event.get_field('ipv4.src')),\
                ('ipv4.dst', event.get_field('ipv4.dst')),\
                ('EventTime', event.get_field('EventTime')),\
                ('modbus.trans_id', event.get_field('modbus.trans_id')),\
                ('modbus.query.write_multiple_registers.starting_address', event.get_field('modbus.query.write_multiple_registers.starting_address')),\
                ('modbus.query.write_multiple_registers.registers', event.get_field('modbus.query.write_multiple_registers.registers')),\
                ('modbus.response.write_multiple_registers.qty_of_regs', event.get_field('modbus.response.write_multiple_registers.qty_of_regs'))])

            module['modbus_msg_queue'].append(ev_summary)
        elif mb_resp_addr == DEV_PWD_REG_ADDR:
            ip_src  = event.get_field('ipv4.src')
            match = get_matching_query(event.module, trans_id, ip_src)

            # We could log all login attempts, too:
            if (mb_addr == DEV_PWD_REG_ADDR):
                pass

    elif mb_func == "Write Multiple Registers Error (0x90)":
        trans_id = event.get_field("modbus.trans_id")
        ip_src  = event.get_field("ipv4.src")
        match = get_matching_query(event.module, trans_id, ip_src)

        if match is None:
            return
        else:
            mb_addr = match["modbus.query.write_multiple_registers.starting_address"]

            if (mb_addr == DEV_PWD_REG_ADDR):
                event.set_field("SecurityAlert", "Bad login")
                event.set_field("SecurityDetails", str(match))
Our function, modbus_postproc, starts by retrieving the function
code. We are only interested in Write Multiple Register-family functions
(requests, responses, and errors).
For every non-error packet, we attempt to retrieve the request or response
address (only one of them will be available, depending on whether the
packet was a request or a response). We store a subset of each request’s
data in a global queue, and we retrieve and drop packets from it (via
get_matching_query()) as responses arrive.
For error packets, we try to retrieve the corresponding request from the
queue. This doesn’t always succeed — for example, the corresponding
request may have been issued before capture began. In this case, we look
at the write address, and if we find that this address corresponds to
the passphrase register address, we tag the packet with two
additional fields, SecurityAlert and SecurityDetails.
This is what the output looks like now:
{
  "ipv4.dst": "10.0.2.24",
  "ipv4.src": "10.0.2.15",
  "modbus.function_code": "Write Multiple Registers (16)",
  "modbus.length": "19",
  "modbus.prot_id": "0",
  "modbus.query.write_multiple_registers.byte_count": "12",
  "modbus.query.write_multiple_registers.qty_of_regs": "6",
  "modbus.query.write_multiple_registers.registers": "97, 98, 99, 100, 101, 102",
  "modbus.query.write_multiple_registers.starting_address": "31",
  "modbus.trans_id": "7",
  "modbus.unit_id": "10",
  "tcp.dst_port": "502",
  "tcp.flag": "[ACK]",
  "tcp.src_port": "39565",
  "EventTime": "2020-09-23T12:02:13.754660+03:00",
  "EventReceivedTime": "2020-09-24T16:34:10.572166+03:00",
  "SourceModuleName": "pcap",
  "SourceModuleType": "im_pcap"
}
{
  "ipv4.dst": "10.0.2.15",
  "ipv4.src": "10.0.2.24",
  "modbus.function_code": "Write Multiple Registers Error (0x90)",
  "modbus.length": "3",
  "modbus.prot_id": "0",
  "modbus.response.write_multiple_registers.exc_code": "Illegal Data Address (02)",
  "modbus.trans_id": "7",
  "modbus.unit_id": "10",
  "tcp.dst_port": "39565",
  "tcp.flag": "[ACK]",
  "tcp.src_port": "502",
  "EventTime": "2020-09-23T12:02:13.755086+03:00",
  "EventReceivedTime": "2020-09-24T16:34:10.572185+03:00",
  "SourceModuleName": "pcap",
  "SourceModuleType": "im_pcap",
  "SecurityAlert": "Bad login",
  "SecurityDetails": "{'ipv4.src': '10.0.2.15', 'EventTime': '2020-09-23 12:02:13', 'modbus.trans_id': '7', 'modbus.query.write_multiple_registers.starting_address': '31', 'modbus.query.write_multiple_registers.registers': '97, 98, 99, 100, 101, 102', 'modbus.response.write_multiple_registers.qty_of_regs': None}"
}
Note that only the exception packet is tagged. We could, of course, tag both. If we did, we could choose to log all login attempts, both successful and failed login requests.
Logging security alerts via Microsoft Azure Sentinel
We have one ingredient left in our Modbus monitoring sauce: we want to log events with tagged packets in an Azure Sentinel table. Fortunately, we can easily send data to Log Analytics workspaces using the Microsoft Azure Sentinel (om_azure) module. All we will need is our Workspace ID, a SharedKey (either the Primary or Secondary key will work), and a name for the Azure Sentinel table.
From our azure output instance we invoke the post-processing function to
check for the existence of the SecurityAlert field. If it doesn’t exist,
the packet will be dropped. Otherwise, it will be sent as a JSON record.
define WORKSPACE  157dd880-20ec-4b54-940e-d0447d19da40
define SHAREDKEY  2XfYiFggqvWlyH2aKT9Hg9CaWshNS+y65ydTcVQ0n8BwSTnPpDTzJhO1Tl28J0bXlBnn3eWcfFN+mH/8478Vmw==
define SUBDOMAIN  ods.opinsights.azure.com
define RESOURCE   api/logs
define APIVER     api-version=2016-04-01

<Output azure>
    Module        om_azure
    URL           https://%WORKSPACE%.%SUBDOMAIN%/%RESOURCE%?%APIVER%
    HTTPSCAFile   %CERTDIR%/ca.pem
    WorkspaceID   %WORKSPACE%
    SharedKey     %SHAREDKEY%
    TableName     "NXLogSCADALog"
    <Exec>
        pyxm->call("modbus_postproc");
        to_json();
        if not defined $SecurityAlert drop();
    </Exec>
</Output>
Of course, we also need to add the correct route:
<Route in_file_to_out>
     Path     pcap => azure, file
</Route>
and we are done! Running with this configuration will give us an entry
in a custom Azure Sentinel log called NXLogSCADALog_CL. This is what such
an entry would look like, in CSV format:
TenantId,SourceSystem,MG,ManagementGroupName,TimeGenerated,Computer,RawData,"ipv4_dst_s","ipv4_src_s","modbus_function_code_s","modbus_length_s","modbus_prot_id_s","modbus_response_write_multiple_registers_exc_code_s","modbus_trans_id_s","modbus_unit_id_s","tcp_dst_port_s","tcp_flag_s","tcp_src_port_s","EventTime_t","EventReceivedTime_t","SourceModuleName_s","SourceModuleType_s","SecurityAlert_s","SecurityDetails_s",Type,"_ResourceId"
"157dd880-20ec-4b54-940e-d0447d19da40",RestAPI,,,"2020-09-24T15:06:48.692Z",,,"10.0.2.15","10.0.2.24","Write Multiple Registers Error (0x90)",3,0,"Illegal Data Address (02)",7,10,39565,"[ACK]",502,"2020-09-23T09:02:13.755Z","2020-09-24T15:06:48.918Z",pcap,"im_pcap","Bad login","{'ipv4.src': '10.0.2.15', 'ipv4.dst': '10.0.2.24', 'EventTime': '2020-09-23 12:02:13', 'modbus.trans_id': '7', 'modbus.query.write_multiple_registers.starting_address': '31', 'modbus.query.write_multiple_registers.registers': '97, 98, 99, 100, 101, 102', 'modbus.response.write_multiple_registers.qty_of_regs': None}","NXLogSCADALog_CL",
Common pitfalls
In our example above, we did gloss over some of the murkier details of processing real-world Modbus traffic. The most obvious fact that we omitted is that entries in the request queue should not stay around forever — they should be dropped if they aren’t retrieved after a while.
As we alluded to before, more advanced setups (such as those which include serial - TCP gateways) may need even more advanced matching rules, too. Transaction IDs are used to track transactions within the scope of the same TCP connection. Consequently, reliably matching queries and replies via transaction IDs also requires tracking TCP connections so that packets are always matched within the scope of the same TCP connections. This is less problematic for small networks though, and well beyond the scope of this article.
Data reassembly rules can also become more complex when it comes to
arbitrary data writes. For example, registers can be written via several
commands, including Write Single Register and Write Multiple Registers.
Extracting the exact data written at a particular address can
require handling more request types, and more advanced rules, which have
to account for address ranges and possibly for additional data types
"tunneled" on top of Modbus registers and coils.
Managing SCADA security incidents with Microsoft Azure Sentinel
Having uploaded Modbus traffic information to the SIEM’s table, we are now ready to use the data for incident detection, incident management, and response automation purposes.
At this point, the data we have is not actionable: all we have is a set of records about traffic and potential security incidents, but this data is not yet visible in a security context, only in an analytics table. Furthermore, there is no meaning attached to it, no information about its potential security implications, and no way to identify it for investigation and management purposes. In other words, it’s still "raw data".
Azure Sentinel exposes security data using a hierarchy of alerts and incidents. Alerts are the primary means of organizing security information data. One, or several correlated alerts, make up an incident.
An alert is an event generated by examining previously-recorded data based on a set of analytics rules. One or more alerts that are correlated in some manner can be organized into an incident. Alerts effectively "give meaning" to a set of Analytics records: they have names, descriptions, and can be classified in various ways — based on MITRE ATT&CK framework tactics, for example.
An incident is an aggregation of all the relevant evidence for a specific investigation, effectively a labeled token that you can manage. You can assign it to someone, you can use it as the basis for automated response, and you can use it to establish auditing trails.
To illustrate this concept, we are going to create a custom analytics rule that will allow us to trigger alerts whenever an unsuccessful login attempt is detected. Triggering this alert will create an incident that you can then manage according to site-specific incident investigation rules.
Configuring custom analytics rules for alerts
Microsoft Azure Sentinel comes with more than 150 pre-defined templates for security alerts. These are useful as starting points, but they obviously cannot cover every conceivable scenario, which is why Sentinel also allows you to configure your own alert rules.
We are going to configure one that will trigger an alert whenever an unsuccessful login is detected.
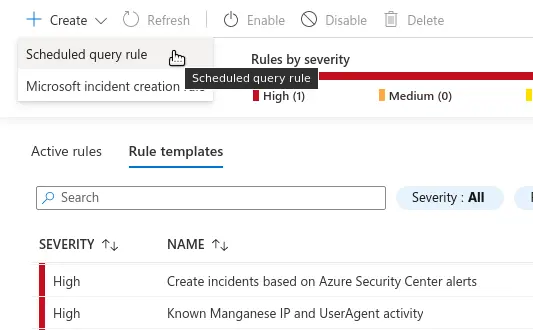
Step 1. On the Sentinel Dashboard, go to Analytics, then click the Create menu in the upper-left corner of the dashboard and choose Scheduled query rule.
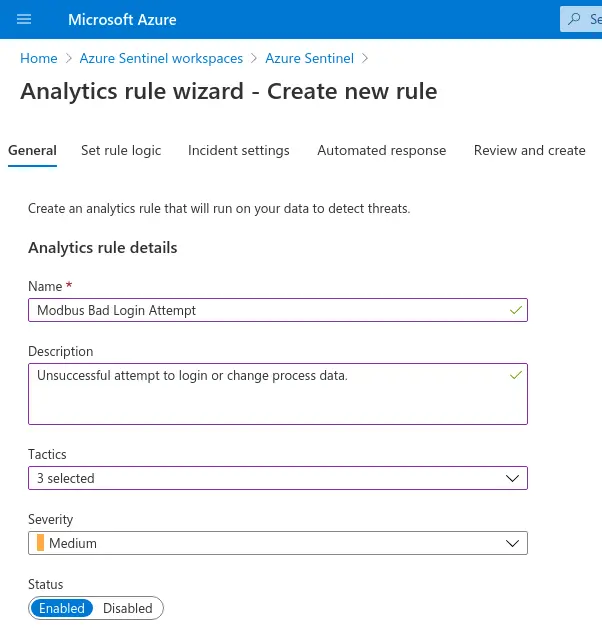
Step 2. On the first screen, configure the Name, Description, and Severity of the alert. You can also label it by Tactics at this stage.
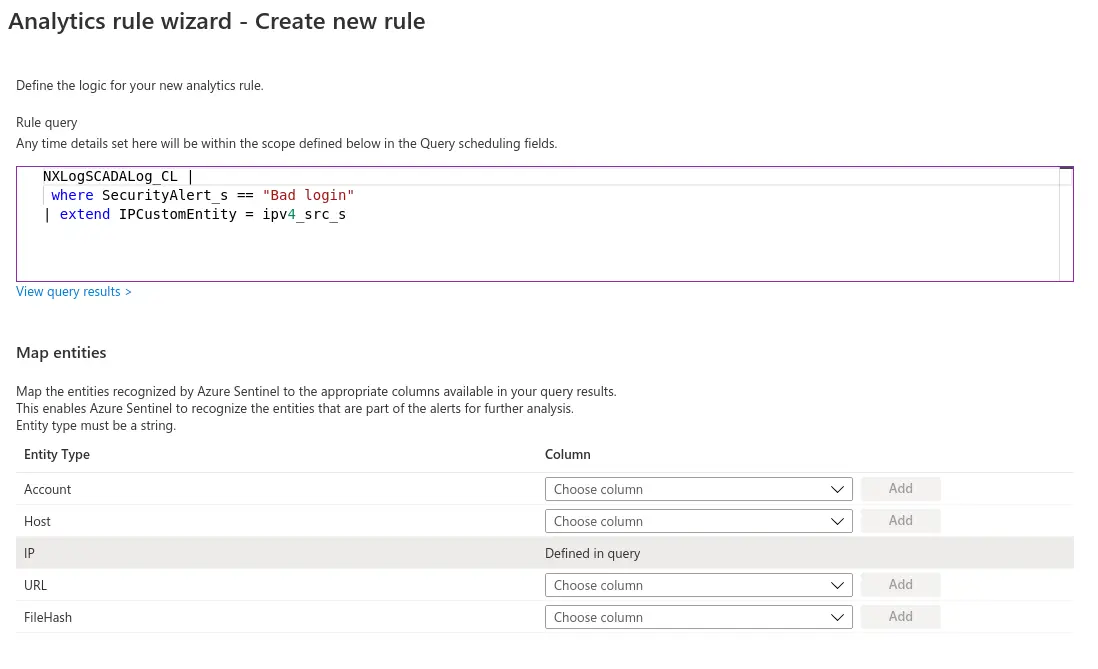
Step 3. On the Set rule logic screen, configure the query whose results
will provide the data that triggers the alert. In our case, the alert
will be triggered whenever there’s a new entry in the NXLogSCADALog_CL
table that has Bad login in its SecurityAlert_s field. The
relevant query is as follows:
NXLogSCADALog_CL |
 where SecurityAlert_s == "Bad login"
Azure Sentinel recognizes some standard entities that are typically
relevant for security investigation processes, such as Host, IP, and
URL. These can be mapped to fields in custom tables (such as our
NXLogSCADALog_CL table) in the Map Entities section of this
page. Mapping data is automatically added to your custom query.
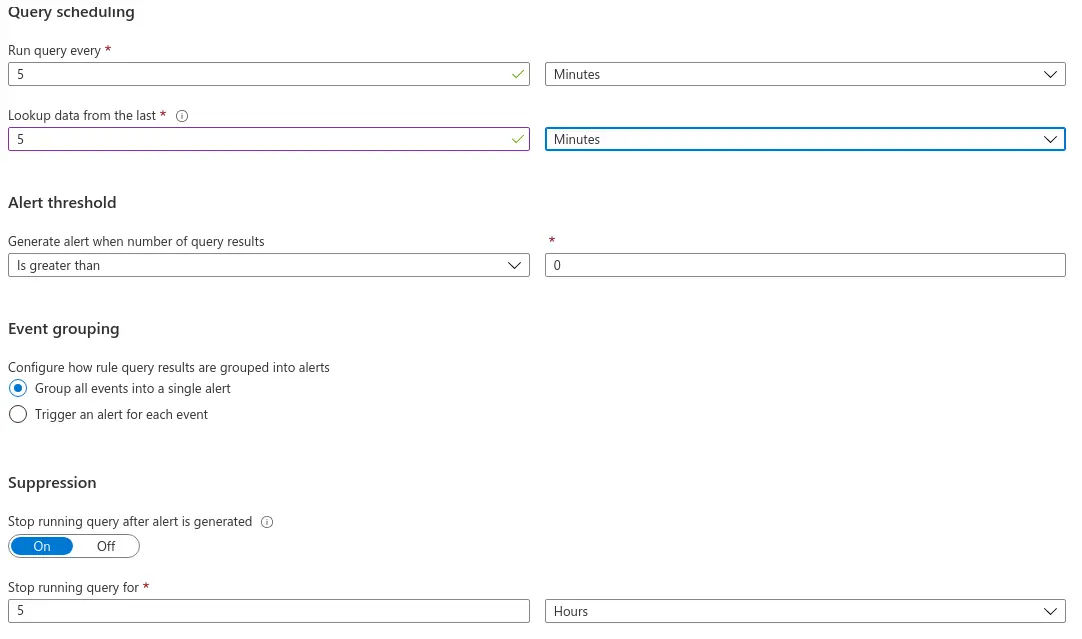
Two other things that you want to configure on this screen are the scheduling policy and the alert threshold for this query. Custom queries are run at customizable intervals and can be configured to query only data gathered over a specific interval prior to the moment they are executed. It is possible to trigger the alert as soon as the query yields a single result, but you can also configure higher alert thresholds. These parameters allow you to fine-tune the system’s response time and to rate-limit event generation without compromising sensitivity.
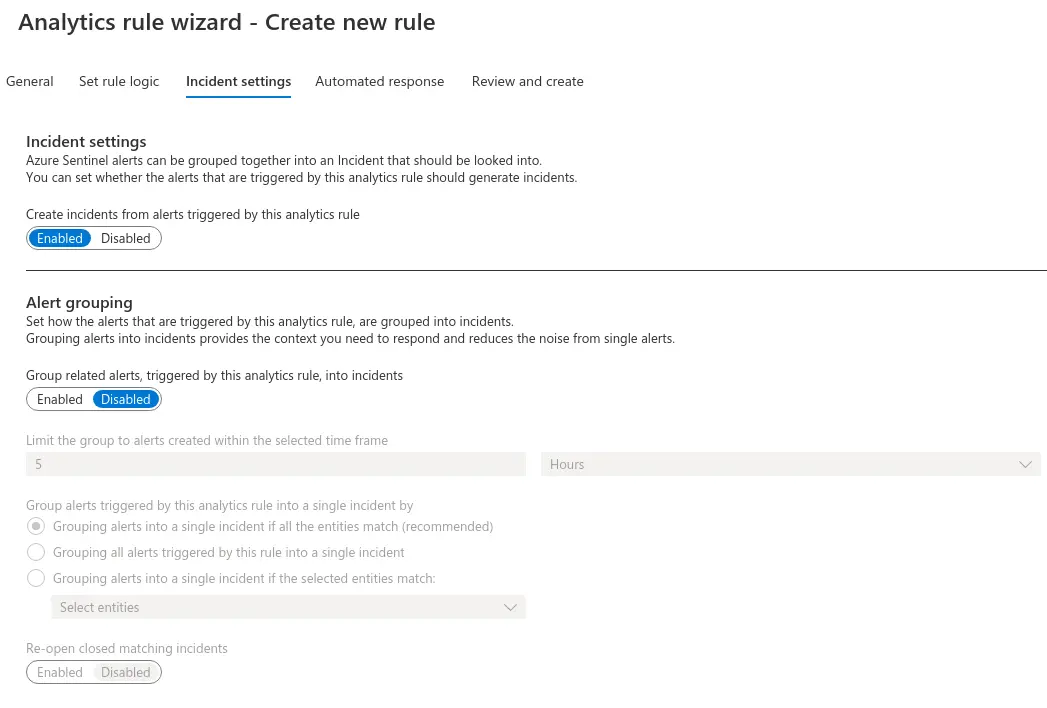
Step 4. In the next screen, make sure the Create incidents from alerts triggered by this analytics rule setting is set to Enabled. You can also configure how alerts are grouped into incidents on this screen. In our case, Alert grouping doesn’t make much sense, so we will leave it Disabled.
Step 5. The next screen allows you to configure automated response. We will not cover that here, but if you would like to know more, the Azure Sentinel documentation covers automated response via security playbooks in great detail. Click Next to go the Review and Create screen where you will get the chance to review and validate the alert settings. Once the rule is validated, you can click Create to initialize your alert rule to save the new rule and begin using it.
The new query will be scheduled to run according to the parameters that we chose earlier. When suspicious traffic is detected, a new incident will be created, and it will be available in the Incidents dashboard:
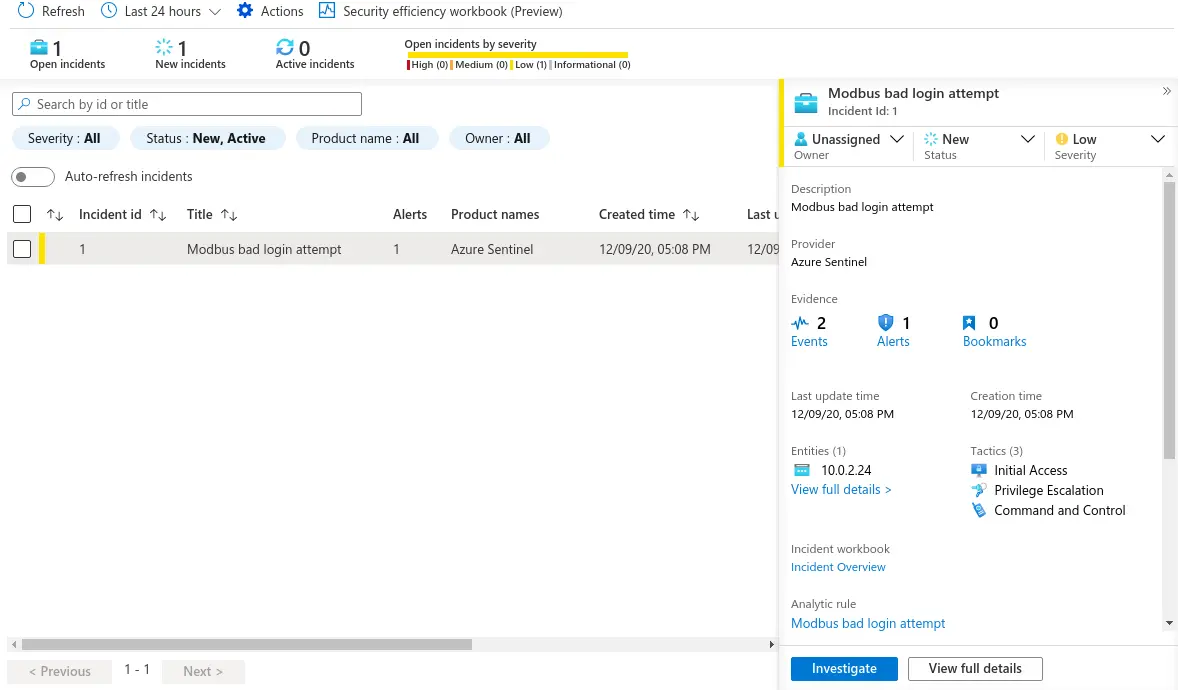
Exposed as an incident, the information in the traffic captures is now an actionable item. Incidents can be assigned for further investigation and their lifetime can be managed according to company-specific rules. They aggregate the information required to mount a response — which can be automated, via Azure security playbooks — and, if additional data is required, it can be gathered via Sentinel’s incident investigation features.
Conclusions
The example we just explored was fairly simple, but this technique is a good starting point for many real-world devices and networks. NXLog’s flexible, modular log collection and processing capabilities enable you to easily extend them to handle a wide range of devices and applications. The wealth of output modules and extension options make it easy to integrate a wide range of data sources and endpoints, as well as balance processing tasks between cloud and edge devices in an optimal manner.