
If you’re a cyber security enthusiast, you’ve probably heard a lot about Windows Management Instrumentation (WMI) lately. There’s a good reason why this topic has gained popularity, however, this technology has been integrated into Windows operating systems for over 20 years now. In this blog post, we will delve into how WMI works, the risks resulting from misuse, and how to audit it with NXLog.
A standardization effort
The first thing to clarify about WMI is that it’s not a Windows-only technology. It is Microsoft’s implementation of WBEM and CIM, both of which are standards created by DMTF to streamline management of different devices and systems across distributed environments in a way that’s vendor-agnostic.
Put in simple terms, WMI is an alternative means of managing, storing and querying information, generating events, and implementing functionality in Windows operating systems. Along with GUI applications, a CLI interface, and PowerShell, WMI is another way to manage Windows systems. For years, while this powerful technology was still unknown to most, attackers had already learned how to exploit it.
Brief overview of WMI
WMI is installed and enabled by default from Windows 2000 onward. There are many options to access and query a system using WMI:
-
wmic (WMI command-line tool)
-
PowerShell (WMI cmdlets)
-
WQL queries (SQL-like language, often used with PowerShell cmdlets)
-
WBEMTest.exe (a GUI tool for WMI testing)
-
Programming languages (most popular languages include libraries for WMI)
-
Third-party WMI explorer applications (free and paid options)
-
WMI can also be used remotely via WinRM and the "WMI Plugin" or using DCOM
Information is organized hierarchically in namespaces, which contain classes, which in turn contain:
-
Properties: Information that can be queried
-
Methods: Functionality that can be implemented via WMI
-
Instances: Instance of class objects
-
Events: Capability to generate notifications
Essentially, you’re dealing with a specialized, interactive database (the WMI Repository) that gives you read/write access to operating system objects. At the risk of over-simplifying WMI, this statement should give you a sense of how powerful this technology is, and why it is used as an attack vector.
WMI misuse
The thing about powerful technology is that it remains powerful despite who’s using it and what the intentions for its use are. Just as PowerShell was highly abused in its inception (and still is, albeit being more difficult with Microsoft’s newer built-in defense mechanisms), WMI is like a "dormant giant" which is awoken from time to time for malicious purposes. Below, we take a look at some real-life examples of WMI abuse, specifically as it relates to malware.
Fileless malware attacks
One of the key use cases for WMI as an attack vector is fileless malware. How can malware be fileless, you may ask?
The technologies and techniques used may vary, but if you think about it, malware is software (malicious of course), and software is simply a set of instructions for a machine to execute. In conclusion, we can deduct that "fileless malware" is software that has been embedded with instructions intended to spy on or harm the system, without having to store them on a file on disk.
The following two use cases explore how WMI can be used as an instrument for fileless malware.
Persistent backdoor using PowerShell and WMI
The first publicly known occurrence of malicious WMI use was Stuxnet more than ten years ago, and as you may recall, this was a rather sophisticated attack from a well-funded hacking team.
One group that has perfected the use of WMI as a stealthy and efficient backdooring mechanism is APT29 (aka "Cozy Bear"). APT29 is one of the top global hacking groups, targeting governments, think tanks, and international organizations. This shows just how powerful of a tool WMI can be when used knowledgeably.
In the case of APT29, they found in PowerShell and WMI a perfect backdoor recipe using a "living off the land" strategy. It means that native OS tools and 100% legitimate configurations are used to deliver the malicious logic. This is as stealthy as it gets.
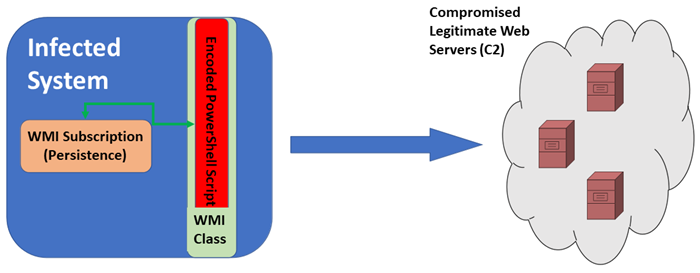
The POSHPY backdoor was designed to use WMI for storage and persistence while leveraging PowerShell to write and execute the backdoor logic:
-
Using the capability to extend default classes, a new WMI class is created.
-
The extended class stores the encrypted PowerShell script in one of its properties.
-
The event subscription capability in WMI is used to provide persistence to the backdoor, constantly executing it according to a defined event schedule.
-
Geographically local, compromised web servers are used for C2, making it even more difficult to trace.
WMI hijackers
Using WMI as a means to enable malware activities is called WMI hijacking since the malicious actor is taking a valid software asset and weaponizing it for their purposes. The previous example regarding the POSHPY backdoor is also a form of WMI hijacking, but a very special one because of the overall strategy employed.
WMI hijackers are common these days, so common that they’re a sort of digital plague; it’s like fileless WMI malware, commoditized. The following is a list of some well-known malware using WMI hijacking:
-
Molerats (aka The Gaza Cybergang) is using MoleNet downloader, which includes the capability to profile the target OS using WMI queries such as:
SELECT * FROM FirewallProduct SELECT * FROM AntivirusProduct SELECT * FROM Win32_PhysicalMedia SELECT * FROM Win32_ComputerSystem SELECT * FROM Win32_DiskDrive SELECT * FROM Win32_LogicalDiskToPartition -
Emotet uses WMI to execute PowerShell encoded commands and download its second stage trojan.
-
jRAT uses a WMIC command to find antivirus and firewall software installed on the system:
> wmic /node:localhost /namespace:\\root\SecurityCenter2 path AntiVirusProduct get /format:list
Examples abound, so if you’re interested in investigating more scenarios, launch a search for "WMI" on the MITRE website and have hours of fun!
WMI auditing
And now we’ve finally come to the topic that probably drew you in to read this article in the first place. WMI can be a complex topic, so besides understanding the context of "why" this technology requires administrative attention, we need to make sure we’re clear on what we’re looking for before we start turning switches on and off. From the malicious use cases described above, we can glean the following key points of interest from an auditing perspective:
-
Storage: This is an ideal capability since the malicious script does not appear as a script file to the system’s defenses. To store code in a class property, the malware needs to write into a class and this can be audited.
-
Persistence: To achieve persistence, WMI attacks require an event subscription to be created. In WMI a subscription is comprised of:
-
An event filter: The event of interest.
-
An event consumer: The action performed when the event of interest is triggered.
-
A filter to consumer binding: The registration mechanism that "glues" filter and consume together. The creation of new consumers can be audited, which is a critical piece to capture for detection.
-
-
Execution: When the attackers are using a "living off the land" philosophy, they will typically pair WMI with PowerShell, since this is a native tool that allows them to encode and execute code stored in the WMI class. Both the use of PowerShell, as well as the spawning of new processes via WMI, can be audited.
-
System Profiling: Most malware uses WMI in a much less sophisticated manner than the mechanisms mentioned here, simply as more stealthy reconnaissance or system profiling tools. Let’s remind ourselves that the core purpose of WMI centers around system management, hence the entire OS is exposed to WMI for monitoring. Access to namespaces and classes can be audited.
With these four key points in mind, we present a strategy for WMI auditing and how the logs generated can be collected by NXLog.
Enable and capture Windows Security auditing events
Windows security auditing is a Local Security Policy setting that enables events to be triggered when any attempt is made to access or modify a SACL-protected system resource, regardless of success or failure. SACL stands for System Access Control List. For further information see Microsoft’s documentation on Access Control Lists.
Windows security auditing events will increase the number of events generated by the system, and they can be very verbose, which is likely one of the reasons it’s not enabled by default. Enabling object auditing, however, will dramatically increase our chances to detect malicious WMI activity.
To test the effects of enabling the audit policy for object access, we will use a simple WMIC command that lists active processes on a system:
> wmic process list briefWith such a powerful command like this, that can retrieve information from memory for each active process, you would think it would light up with Windows events like a Christmas tree.
Well, guess what? All you get is a single event in the Microsoft-Windows-WMI-Activity/Operational log that’s no different than what is produced by other sources.
The only thing it provides is a notification of when WMI activity was recorded.
Log Name: Microsoft-Windows-WMI-Activity/Operational
Source: Microsoft-Windows-WMI-Activity
Date: 12/13/2021 6:31:41 PM
Event ID: 5857
Task Category: None
Level: Information
Keywords:
User: SYSTEM
Computer: WIN-83IICQNI6G3
Description:
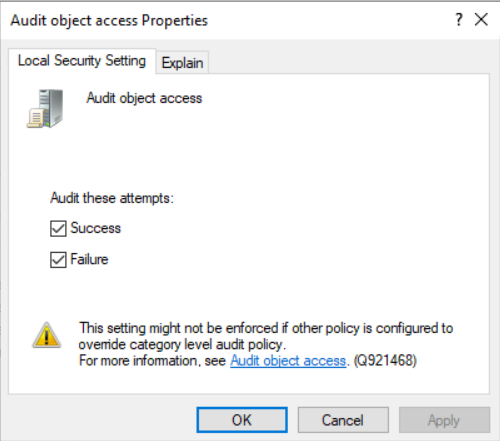
deploymentprovider provider started with result code 0x0. HostProcess = wmiprvse.exe; ProcessID = 2868; ProviderPath = %systemroot%\system32\wbem\ServerManager.DeploymentProvider.dllWe can improve this by turning on a couple of knobs in the Local Security Policy (secpol.msc). From there, expand Local Policies > Audit Policy.
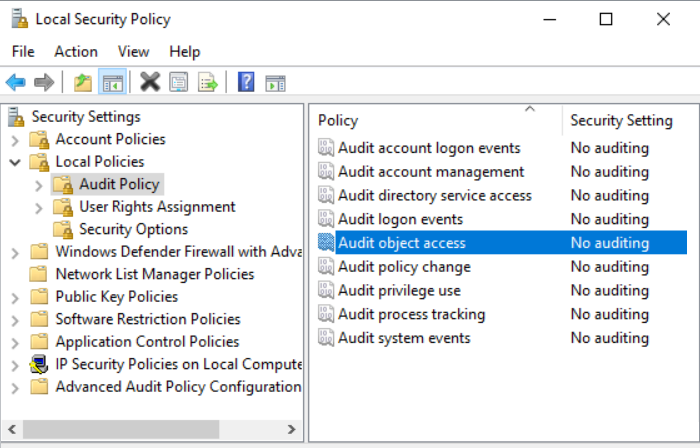
Double-click on Audit object access and enable both Success and Failure. Click Apply followed by OK to save settings.
Now, if we execute our test WMIC command from above, the results will be very different from what we initially saw.
This time around, the Security log shows three events, each one having a different Event ID: 4656, 4663, and 4658.
Of these three, the one providing the most information is identified by Event ID 4656: A handle to an object was requested.
A handle to an object was requested.
Subject:
    Security ID:         WIN-83IICQNI6G3\Administrator
    Account Name:        Administrator
    Account Domain:      WIN-83IICQNI6G3
    Logon ID:            0x33D92
Object:
    Object Server:       Security
    Object Type:         Process
    Object Name:         \Device\HarddiskVolume2\Windows\System32\lsass.exe
    Handle ID:           0x544
    Resource Attributes: -
Process Information:
    Process ID:          0x798
    Process Name:        C:\Windows\System32\wbem\WmiPrvSE.exe
Access Request Information:
    Transaction ID:      {00000000-0000-0000-0000-000000000000}
    Accesses:            Read from process memory
                         Query process information
                         Undefined Access (no effect) Bit 12
Access Reasons:          -
Access Mask:             0x1410
Privileges Used for Access Check: -
Restricted SID Count:    0
If you examine this event carefully, it contains user information as well as the nature of the query.
It tells you which object was accessed and the executable that processed the query: C:\Windows\System32\wbem\WmiPrvSE.exe.
From this information, you can identify what a person is trying to do using WMI.
It gets even better, because we can enable WMI-specific auditing in order to generate events containing even more detail.
To do this, you need to open the Windows MMC (mmc.exe) and add the WMI Control snap-in.
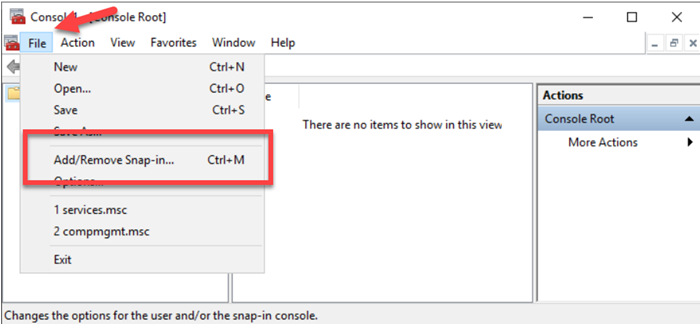
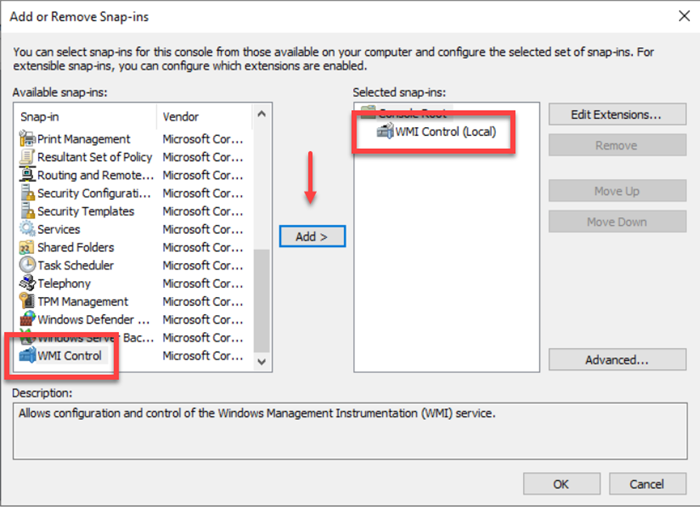
This brings up the WMI-specific Access Control module, which includes the auditing capability.
-
Right-click the newly added module, and select Properties.
-
On the Security tab, select Root and click the Security button.
-
Click the Advanced button.
-
On the Auditing tab, click the Add button.
At this point, choose the security principals that will need to have auditing enabled.
The screenshot below shows the Administrator user, but consider adding all relevant accounts to be monitored.
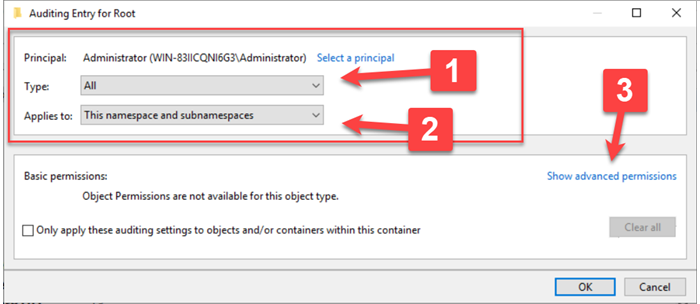
The enumerated parts of the Auditing Entry for Root window can be explained as follows:
-
Type: All: This means we will audit both Success and Failure events.
-
Applies to: By selecting This namespace and subnamespaces we ensure the entire WMI namespace scope is audited (you can modify this as needed).
-
Show advanced permissions: This will display a new set of options concerning the activities that will be audited. For this example, we have selected all of them since we want as much visibility as possible into what WMI is being used for.
Once the configuration is applied, we can execute the wmic process list brief command again.
Event ID 4662 ("An operation was performed on an object.") will now be logged in the Security log; if you pair this with Event ID 4656 you get a very clear picture of what occurred.
See how Event ID 4662 below shows the exact query that was made on the system (in "Parameter 2", under "Additional Information"):
An operation was performed on an object.
=
Subject :
    Security ID:        WIN-83IICQNI6G3\Administrator
    Account Name:       Administrator
    Account Domain:     WIN-83IICQNI6G3
    Logon ID:           0xA5346
Object:
    Object Server:      WMI
    Object Type:        WMI Namespace
    Object Name:        ROOT\CIMV2
    Handle ID:          0x0
Operation:
    Operation Type:     Object Access
Accesses:               Unknown specific access (bit 0)
Access Mask:            0x1
    Properties:         -
Additional Information:
    Parameter 1:        Local Read (ExecQuery)
    Parameter 2:        ROOT\CIMV2:SELECT ThreadCount, HandleCount, Name, Priority, ProcessId, WorkingSetSize FROM Win32_Process
Enable PowerShell auditing
Another source of meaningful information to help us track WMI activity is PowerShell. Since a PowerShell script is typically executed as part of these attacks, it makes sense to enable PowerShell auditing. Fortunately, this one is pretty straightforward to enable.
You enable this from the Group Policy Editor (gpedit.msc) by expanding Computer Configuration > Policies > Administrative Templates > Windows Components > Windows PowerShell.
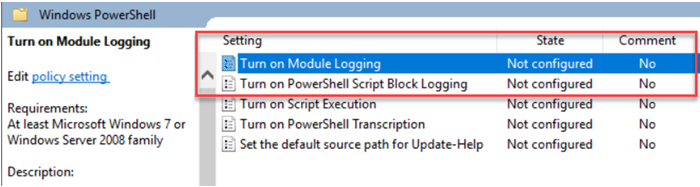
For our use case, we will enable the first two policies:
-
Turn on Module Logging: This setting allows you to log PowerShell modules selectively. For this example, we’re enabling it and using a wildcard (
*) to log all PowerShell modules.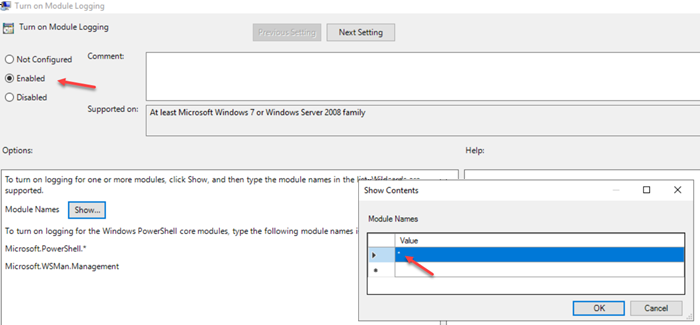
-
Turn on PowerShell Script Block Logging: This settings logs all PowerShell script input to the
Microsoft-Windows-Powershell/Operationalevent log. It is a critical element for tracking the script execution activities discussed above.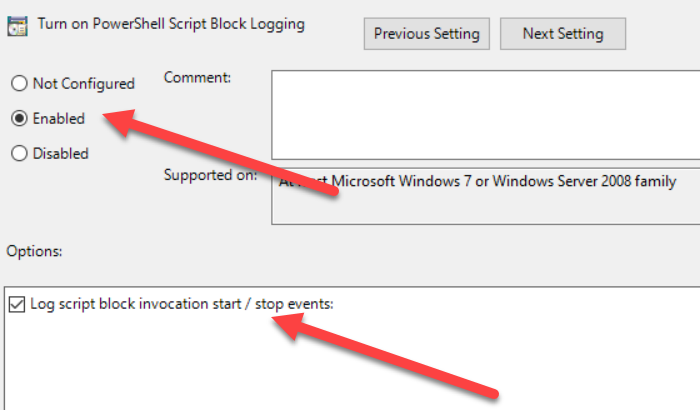
To demonstrate PowerShell auditing, we will use a sample script that disables registry values related to TLSv.1.
Once the script is executed, several events will be logged in the Powershell/Operational log.
We’re especially interested in Event ID 4103, which provides details about scripts executed on the system.
The following event sample shows the script’s full path and filename, and the actual commands it executed.
CommandInvocation(Set-ItemProperty): "Set-ItemProperty"
ParameterBinding(Set-ItemProperty): name="Path"; value="HKLM:\SYSTEM\CurrentControlSet\Control\SecurityProviders\SCHANNEL\Protocols\TLS 1.0\Server"
ParameterBinding(Set-ItemProperty): name="Name"; value="DisabledByDefault"
ParameterBinding(Set-ItemProperty): name="Value"; value="1"
ParameterBinding(Set-ItemProperty): name="Type"; value="DWord"
Context:
      Severity = Informational
      Host Name = ConsoleHost
      Host Version = 5.1.17763.2268
      Host ID = 4b727651-ff05-4ff6-85f1-223ac1d682d9
      Host Application = C:\Windows\System32\WindowsPowerShell\v1.0\powershell.exe
      Engine Version = 5.1.17763.2268
      Runspace ID = 1a85d876-b097-4bba-af5f-aa8469458af8
      Pipeline ID = 55
      Command Name = Set-ItemProperty
      Command Type = Cmdlet
      Script Name = C:\Users\Administrator\Desktop\tls1.ps1
      Command Path =
      Sequence Number = 216
      User = WIN-83IICQNI6G3\Administrator
      Connected User =
      Shell ID = Microsoft.PowerShell
Leverage Sysmon WMI auditing capabilities
If you’ve spent some time administering Windows servers, chances are good that you’ve come in contact with Sysmon. If not, Sysmon is a tool that can capture more information than the default Windows logs. It’s a very useful tool, especially for "obscure" activities that are not addressed very well by the default logs.
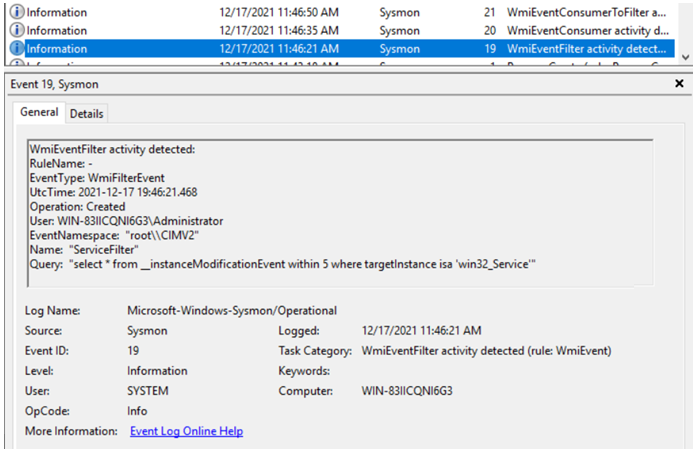
In the case of WMI, Sysmon focuses on logging subscription-related activities, since they’re so sensitive and widely used to launch attacks. You will typically see these events appear consecutively:
-
Sysmon Event ID 19: Tracks WMI filter related activity in detail.
-
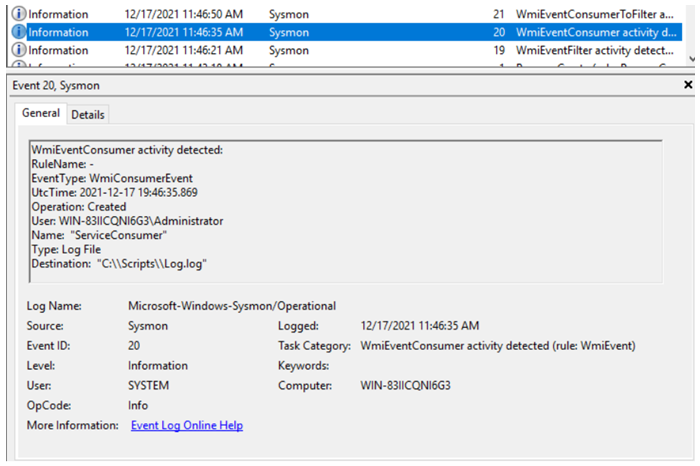
Sysmon Event 20: Tracks WMI consumer related activity in detail.
-
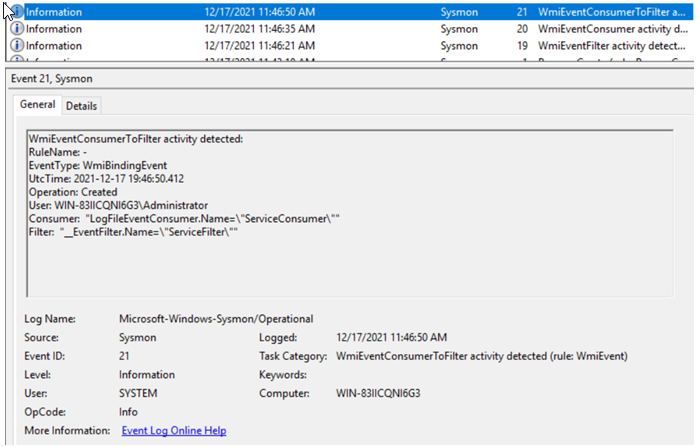
Sysmon Event ID 21: Tracks WMI subscription binding related activities in detail.
This is a set of event IDs you will absolutely want to monitor on your system. They are included in the default configuration provided by the Sysmon developers available on GitHub.
4. Monitor default Microsoft WMI events
The WMI/Operational event log source provides several Event IDs by default. The ones you’ll encounter more commonly are:
-
Event ID 5857: This is the event you will see the most. It is logged every time WMI activity is detected, which makes it a pretty generic event. Trying to make use of this event alone will probably not lead to interesting places. However, it provides you with information that could be valuable if correlated with more descriptive types of events:
-
User account executing the commands
-
WMI provider involved
-
Timestamp
-
Process ID
-
-
Event ID 5858: This is an error type of event that is much more descriptive than the first one. However, it is less common since it is only triggered by error conditions. It provides information related to the error, including the WQL query executed, user ID, as well as system and process IDs.
It’s important not to overlook the WMI/Operational event log even if it feels like the above two events don’t provide much useful information.
Remember that a key strategy behind launching malware using WMI is persistence, and persistence is achieved by generating a subscription.
Here’s where the WMI/Operational event log proves more useful:
-
Event ID 5859 and Event ID 5860: These two events give us a heads up that a notification was triggered and point to subscription-based activity. Event ID 5860 is more detailed and includes the namespace.
-
Event ID 5861: This is the real rock star, recommended by well-known security researchers for providing context on WMI persistence mechanisms. It reveals the details of the subscription, and in some cases could even point to the code used by the malware.
The following is a sample of event ID 5861, providing information about a permanent subscription. With this kind of information at hand, an incident response team can quickly verify and disable the offending subscription, since it includes the location and name of the source.
Namespace = //./root/subscription; Eventfilter = SCM Event Log Filter (refer to its activate eventid:5859);
Consumer = NTEventLogEventConsumer="SCM Event Log Consumer";
PossibleCause = Binding EventFilter:
instance of __EventFilter
  {
    CreatorSID = {1, 2, 0, 0, 0, 0, 0, 5, 32, 0, 0, 0, 32, 2, 0, 0};
    EventNamespace = "root\\cimv2";
    Name = "SCM Event Log Filter";
    Query = "select * from MSFT_SCMEventLogEvent";
    QueryLanguage = "WQL";
  };
  Perm. Consumer:
  instance of NTEventLogEventConsumer
  {
    Category = 0;
    CreatorSID = {1, 2, 0, 0, 0, 0, 0, 5, 32, 0, 0, 0, 32, 2, 0, 0};
    EventType = 1;
    Name = "SCM Event Log Consumer";
    NameOfUserSIDProperty = "sid";
    SourceName = "Service Control Manager";
  };
Trace WMI activity with ETW
A WMI trace log is available in Event Viewer, but it’s not active by default. To activate it, follow the instructions provided by the Microsoft documentation on Obtaining WMI Events Through Event Viewer.
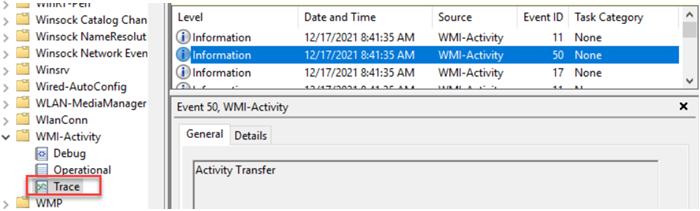
The screenshot above shows the enabled Trace log under the WMI-Activity channel in Event Viewer.
One thing to bear in mind is that tracing often provides events that aren’t meaningful, so baselining and applying filters would be a good idea. For example, you can find better context in events 11 and 17 from the trace log, and can safely discard event 50.
With NXLog’s filtering capabilities, discarding unwanted events is easy and consumes only minimal resources. Filtering out noise events also means that you avoid sending them to your SIEM. Have a look at Filtering logs in the NXLog Platform User Guide for more information on how to apply filtering from the source.
WMI vs. WMI: Self-detection using WMI features
It’s paramount to collect events from different sources and perspectives to gain a complete picture of WMI activity on your system. Mandiant threat researchers came up with a way to turn the enemy’s weapon against themselves. Their process is nicely documented in their blog post WMI vs. WMI: Monitoring for Malicious Activity.
Their script detects WMI-based process executions, as well as new WMI subscription activities, and logs them in the Application log. The script is available in the referenced article that you can download and test out yourself.
|
Note
|
The script is not signed and is not a piece of "official software" so if your PowerShell is using default security settings you may encounter an error message when trying to import the .ps1 file as a module.
Execute the Set-ExecutionPolicy -Scope Process -ExecutionPolicy Bypass command to bypass the restrictions for the current PowerShell session only.
NXLog provides no guarantees and is not responsible for any loss of data or damages as a result of using third-party scripts and software.
|
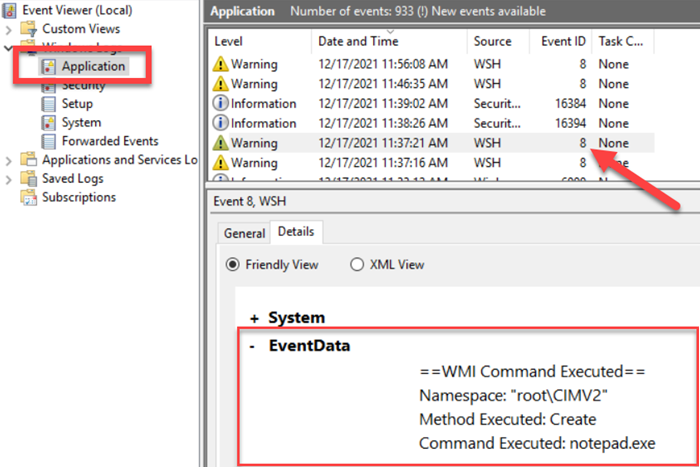
In order to test the WMI-based process execution, use the test provided in the script readme file, or simply start any common process with WMIC:
> wmic process call create "notepad.exe"After executing this command, Event ID 8 with source WSH will be logged in the Applications log:
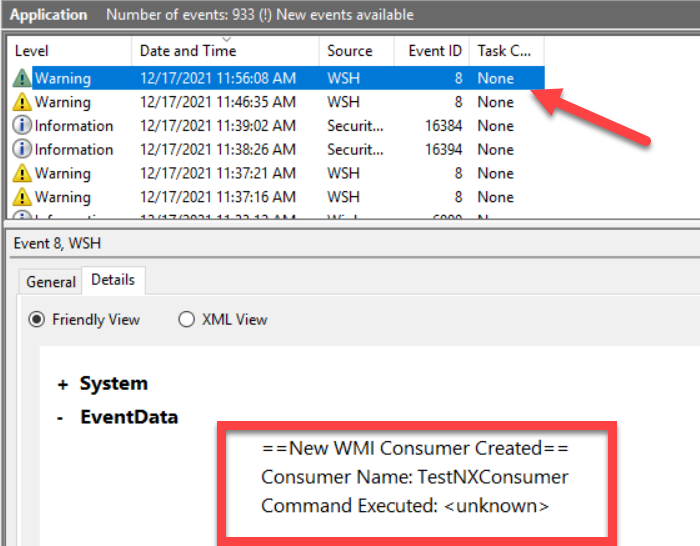
Testing the creation of new consumers and subscriptions requires a bit more effort. See the https://learn-powershell.net blog[ Learn Powershell | Achieve More] post PowerShell and Events: Permanent WMI Event Subscriptions for a detailed explanation. The following is an example of an event logged after creating a new consumer:
NXLog configuration
Now it’s time to put it all together! Although WMI requires this multilayered logging approach we’ve been following, NXLog makes it easy to capture all these valuable events with a single configuration file. We will start by providing individual snippets for each log source followed by a complete configuration.
Audit policies
NXLog provides the im_msvistalog module for collecting Windows events. Once you have enabled object auditing and WMI Control auditing (and optionally others, such as process auditing), all you need to do is to add an im_msvistalog instance to your NXLog configuration file to collect events from the Security log:
<Input eventlog>
    Module             im_msvistalog
    <QueryXML>
        <QueryList>
            <Query Id="0">
                <Select Path="Security">*[EventID=4656 or EventID=4663 or EventID=4662 or EventID=4668]</Select>
            </Query>
        </QueryList>
    </QueryXML>
</Input>
PowerShell auditing
We also learned how to enable PowerShell auditing to obtain details on scripts executed via PowerShell and processes started from this interface.
To collect these logs, we need to add the Microsoft-Windows-PowerShell/Operational log to the previous configuration:
<Input eventlog>
    Module             im_msvistalog
    <QueryXML>
        <QueryList>
            <Query Id="0">
                <Select Path="Security">*[EventID=4656 or EventID=4663 or EventID=4662 or EventID=4668]</Select>
                <Select Path="Microsoft-Windows-PowerShell/Operational">*[EventID=4103]</Select>
            </Query>
        </QueryList>
    </QueryXML>
</Input>
Sysmon events
By now, you’ve probably figured out what’s coming next.
We just need to update the im_msvistalog instance with the event source we need, in this case Microsoft-Windows-Sysmon/Operational:
<Input eventlog>
    Module             im_msvistalog
    <QueryXML>
        <QueryList>
            <Query Id="0">
                <Select Path="Security">*[EventID=4656 or EventID=4663 or EventID=4662 or EventID=4668]</Select>
                <Select Path="Microsoft-Windows-PowerShell/Operational">*[EventID=4103]</Select>
                <Select Path="Microsoft-Windows-Sysmon/Operational">*[EventID=19 or EventID=20 or EventID=21]</Select>
            </Query>
        </QueryList>
    </QueryXML>
</Input>
WMI/Operational events
Next we need to add the default WMI events logged in WMI-Activity/Operational:
<Input eventlog>
    Module             im_msvistalog
    <QueryXML>
        <QueryList>
            <Query Id="0">
                <Select Path="Security">*[EventID=4656 or EventID=4663 or EventID=4662 or EventID=4668]</Select>
                <Select Path="Microsoft-Windows-PowerShell/Operational">*[EventID=4103]</Select>
                <Select Path="Microsoft-Windows-Sysmon/Operational">*[EventID=19 or EventID=20 or EventID=21]</Select>
                <Select Path="Microsoft-Windows-WMI-Activity/Operational">*[EventID=5858 or EventID=5859 or EventID=5860 or EventID=5861]</Select>
            </Query>
        </QueryList>
    </QueryXML>
</Input>
WMI vs. WMI Custom Script
If you’re using the script from the Mandiant fellows or your own version, just make sure you’re including the event path for those events. In our case, we are using the Application log:
<Input eventlog>
    Module             im_msvistalog
    <QueryXML>
        <QueryList>
            <Query Id="0">
                <Select Path="Application">*[EventID=8]</Select>
                <Select Path="Security">*[EventID=4656 or EventID=4663 or EventID=4662 or EventID=4668]</Select>
                <Select Path="Microsoft-Windows-PowerShell/Operational">*[EventID=4103]</Select>
                <Select Path="Microsoft-Windows-Sysmon/Operational">*[EventID=19 or EventID=20 or EventID=21]</Select>
                <Select Path="Microsoft-Windows-WMI-Activity/Operational">*[EventID=5858 or EventID=5859 or EventID=5860 or EventID=5861]</Select>
            </Query>
        </QueryList>
    </QueryXML>
</Input>
ETW events
For collecting ETW logs, NXLog provides the im_etw module. This is a very straightforward configuration:
<Input wmi_etw>
    Module             im_etw
    Provider           WMI_Tracing
    Level              verbose
    MatchAnyKeyword    0xFFFFFFFF
    MatchAllKeyword    0x0
</Input>
Complete configuration file
Putting this all together in a single configuration file, we will define a syslog server and a local file as destinations for the collected events, and then create the appropriate route:
<Extension syslog>
    Module             xm_syslog
</Extension>

<Input eventlog>
    Module             im_msvistalog
    <QueryXML>
        <QueryList>
            <Query Id="0">
                <Select Path="Application">*[EventID=8]</Select>
                <Select Path="Security">*[EventID=4656 or EventID=4663 or EventID=4662 or EventID=4668]</Select>
                <Select Path="Microsoft-Windows-PowerShell/Operational">*[EventID=4103]</Select>
                <Select Path="Microsoft-Windows-Sysmon/Operational">*[EventID=19 or EventID=20 or EventID=21]</Select>
                <Select Path="Microsoft-Windows-WMI-Activity/Operational">*[EventID=5858 or EventID=5859 or EventID=5860 or EventID=5861]</Select>
            </Query>
        </QueryList>
    </QueryXML>
</Input>

<Input wmi_etw>
    Module             im_etw
    Provider           WMI_Tracing
    Level              verbose
    MatchAnyKeyword    0xFFFFFFFF
    MatchAllKeyword    0x0
</Input>

<Output file>
    Module             om_file
    File               'C:\Logs\WMI_Logs.txt'
</Output>

<Output syslog>
    Module             om_tcp
    Host               192.168.10.10:1514
    Exec               to_syslog_ietf();
</Output>

<Route 1>
    Path               eventlog, wmi_etw => file, syslog
</Route>