
In this post, we will look at how to use Raijin Database Engine as a backend in a centralized logging environment for collecting and aggregating Windows security events. We will also show you how to integrate Raijin with an open source data exploration tool. Finally, you will see how you can track suspicious network activity and identify specific types of intrusion on Windows hosts using these tools.
A low-cost, lean and mean data discovery solution
Although the combination of tools we present here cannot compete with a full-fledged SIEM solution, they do offer quite a few advantages for security analysts who need a responsive, highly customizable data discovery solution that accepts ad hoc SQL. When contrasted with a cloud-based SIEM, you are not sharing resources with thousands of other customers. These tools and data are on-prem, self-managed, and there are no costs attached to the volume of ingested data.
Raijin Database Engine has been designed specifically around the needs of high volume, event-based logging. What other database engine has all of these 10 key features? But what about a data visualization? Don’t we need a frontend for dashboards, charts, analytics, and ad hoc queries? Fortunately, Apache Superset fits the bill nicely. Like Raijin, it is SQL-based and thus can integrate with any database that speaks SQL. With its intuitive UI and versatile query and chart-building capabilities, its popularity is growing. Apache Superset has become Airbnb’s preferred BI solution and Dropbox’s data exploration platform of choice.
Creating a Windows intrusion detection test environment
Generating every imaginable type of Windows intrusion in an enterprise environment would be a very time-consuming project.
However, there is a comprehensive collection of Windows security events for this very purpose available on GitHub.
With well over 7,000 events stored in 266 .evtx files, there are plenty of events available for developing whatever types of aggregation queries you might need.
NXLog Enterprise Edition can read Windows Event Log files natively and send them to Raijin.
Installing Raijin Database Engine and Server
You can install Raijin on either Debian-based or RedHat-based (CentOS, SuSE, etc.) systems. See the Raijin Downloads page for details. The Raijin Quickstart page provides enough information to get you up and running.
Using your web browser for accessing the Rajin Server’s web-based UI via http://localhost:2500 create a new database and table for storing Windows security events:
create database security;
use security;
create table windows("EventTime" DATETIME, "EventReceivedTime" DATETIME);
The Raijin User Guide is bundled with the installation and can found under /opt/raijin/doc/html/raijin-user-manual.html or as a PDF under /opt/raijin/doc/raijin-user-manual.pdf if you used the default installation path.
Sending Windows security events to a Raijin server
For reading native Windows Event Log files in .evtx format, we need the NXLog Enterprise Edition agent.
If you are not already an NXLog customer, visit the NXLog Enterprise Edition Downloads page and select NXLog Enterprise Edition v5 trial from the dropdown menu.
With NXLog EE installed and running on a Windows machine, we can update its configuration file shown below to load the Windows (im_msvistalog) input module that supports .evtx files.
In this configuration, the 266 .evtx files representing our test sample of Windows security events were copied from their respective directories in the Git repository to a single directory on our Windows host.
|
Note
|
Changes to an existing |
The JSON (xm_json) JSON extension module is loaded to enable the procedure call to be invoked for converting the events on the fly to JSON. The Raijin (om_raijin) output module receives the JSON records and sends them to the Raijin server, database, and table specified in the module instance.
<Extension _json>
    Module          xm_json
</Extension>

<Input evtx_samples>
    Module          im_msvistalog
    File            "C:\\Program Files\\nxlog\\data\\EVTX-ATTACK-SAMPLES\\*.evtx"
    ReadFromLast    FALSE
#    SavePos         FALSE
    Exec            to_json();
</Input>

<Output raijin>
    Module          om_raijin
    URL             http://raijin-1.example.com:2500
    DBName          security
    DBTable         windows
</Output>|
Note
|
In this post, we are only looking at a groomed collection of Windows events specific to intrusion detection. Once our setup is fully configured to detect a wider variety of Windows events associated with cyberattacks, we would add an additional Windows input module (im_etw) that is capable of directly connecting to Event Tracing for Windows (ETW). This module can collect Windows Debug and Analytical channels that are otherwise not available to regular, non-ETW modules and software which are limited to reading only the standard Windows Event Log channels. |
Installing Apache Superset
The easiest way for you to get and use Apache Superset is to install Docker Desktop on your workstation.
Once you have Docker Desktop installed and running, we have created a special Apache Superset 1.2.0 Docker image that already contains the Rajin plugin needed for connecting to your Raijin Server. For instructions on how to download this image and run it in a Docker container, see superset-raijin and follow the steps listed in the Readme section.
Connecting Apache Superset to a Raijin server
The Apache Superset web interface
With the Apache Superset image running in a Docker container and listening on port 8080, you can now access the Apache Superset in your browser using http://localhost:8080
The login credentials have already been set to Username: admin and Password: admin.
Configuring the Raijin database connection
Navigate to Databases and look for the security database in the table of configured databases, then select Edit under Actions.
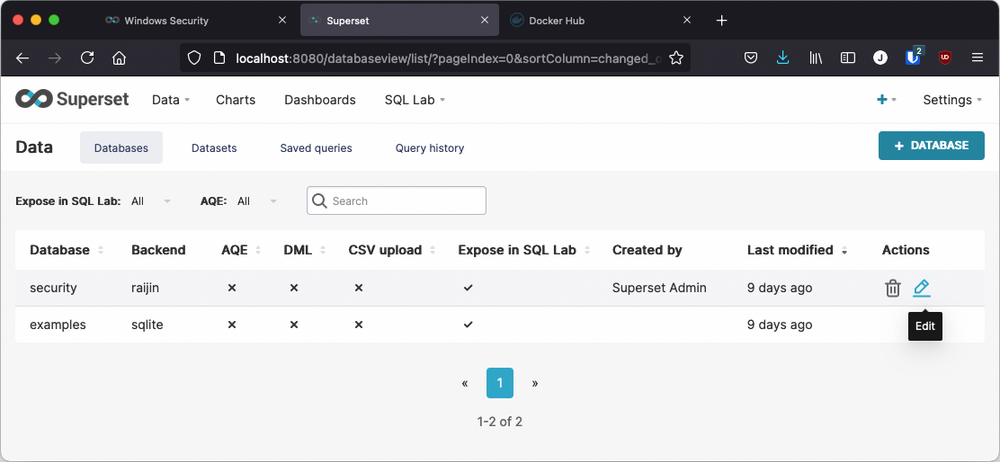
The connection string shown here contains the same Raijin hostname and port as found in the Windows nxlog.conf file: raijin-1.example.com:2500.
If your Raijin installation is running on localhost, you would change the stored value for SQLALCHEMY URI to raijin+http://root:root@localhost:2500/security
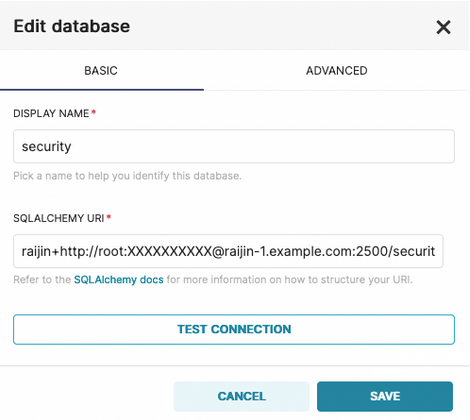
NOTE: The Edit database modal always obfuscates the actual password with XXXXXXXXXX.
Datasets
In Apache Superset, datasets represent the workspace for database tables. Since this Docker image is already populated with databases, tables, and charts, we have already defined the windows dataset. Because different data visualizations often require different columns, or additional computed columns, a one-to-many relationship can exist between a database table and the various datasets that have been created from it.
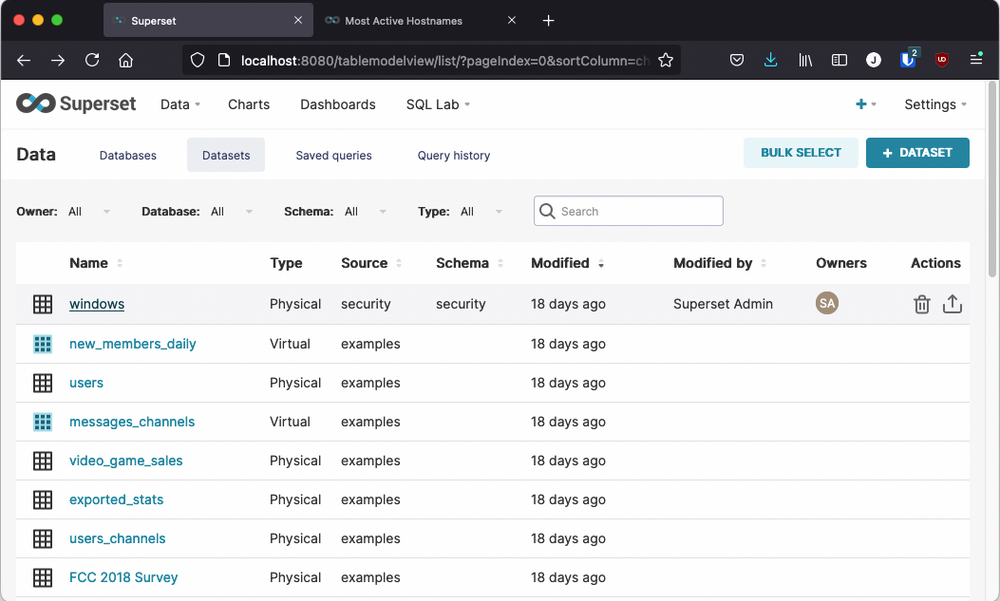
Clicking on the windows dataset will open up the Explore UI which is used for creating a brand new chart as well as for editing existing charts.
Creating queries and charts in Apache Superset
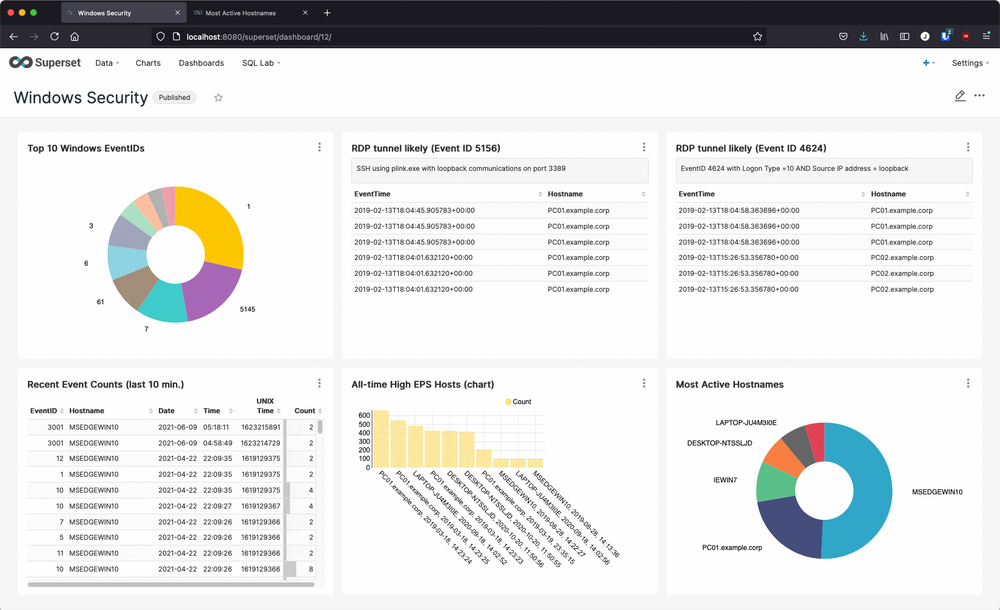
The superset-raijin Docker image we have provided already contains the optional set of Apache Superset sample data (the examples sqlite database), its datasets, charts, stored queries, and its dashboards. Additionally, the windows dataset and its six charts contained within the Windows Security dashboard are also bundled in this Docker image. By opening these charts for editing, you will be able examine their schemas and how their query sections were configured to render the charts as they appear in your Apache Superset UI.
By navigating to Dashboards and opening Windows Security from the list of available dashboards, you can see the charts that are rendered in real time by querying the Windows security events that NXLog EE has collected and forwarded to Raijin. The workflow for each of these charts was the same:
-
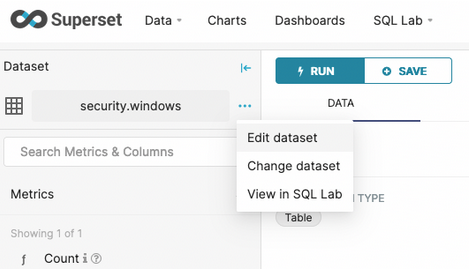
Navigate to Datasets
-
Click on the windows dataset to open the Explore UI
-
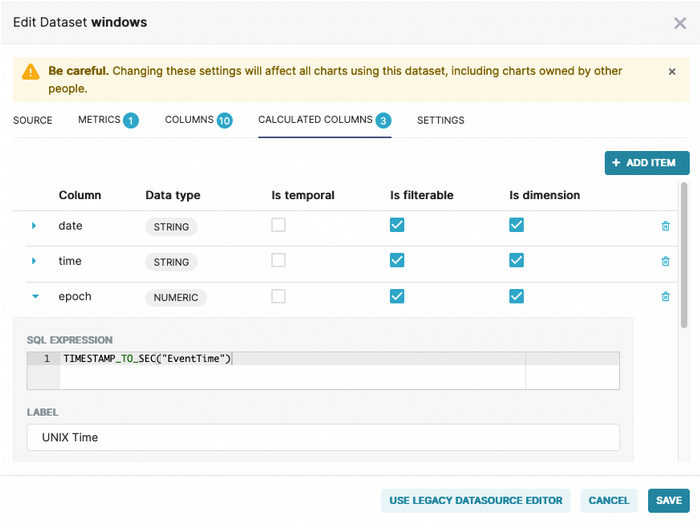
Edit the dataset to add any calculated columns the chart might need
-
Choose the chart type
-
Choose the query type
-
Select the columns and any filters that are needed
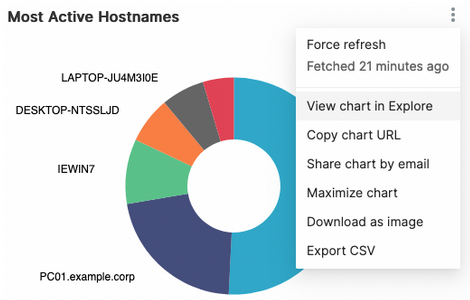
Viewing or editing a specific chart
Find the chart you are interested in and expand its options. Selecting View chart in Explore from the chart’s options list will open a new browser tab where you can view or edit the attributes and query that define the selected chart as shown below.
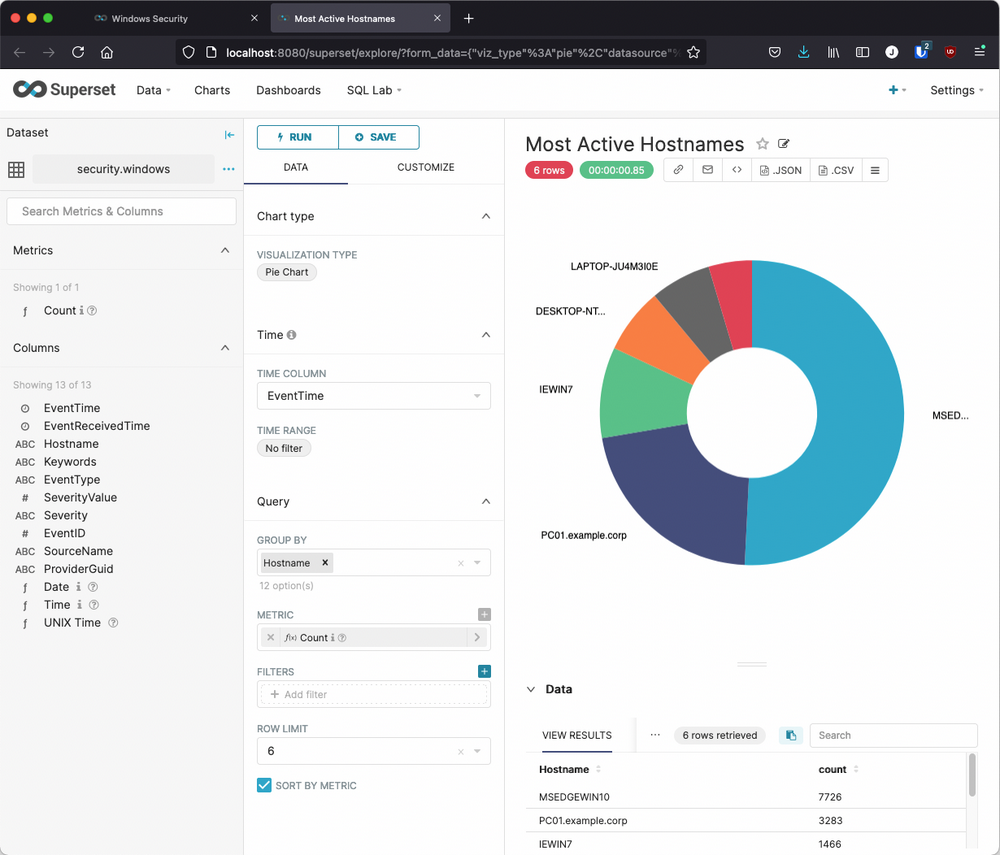
The Explore UI
Here we see the internal definition of the Most Active Hostnames chart in the Explore UI which consists of a web page with a three-column layout:
-
In the left column, the Dataset Name, metrics (for aggregate queries), and columns (names, data types identified as icons or stylized text)
-
In the middle column, Chart actions and attributes, along with Query components and definitions
-
In the right column, the rendered Chart with a tabular view of the Data returned from the query
Detecting defense evasion: RDP over a Reverse SSH Tunnel
Now that we have some experience with the mechanics of getting our logged Windows security events from Raijin into Apache Superset where we can run some analytics, it’s time to look at a strategy for gradually creating charts (or tables) for specific attacks on Windows hosts. For this we have chosen a known exploit in which the Remote Desktop Protocol (RDP) is used by attackers to gain unauthorized access to another network-accessible Windows host.
Although this is not an obscure exploit, the literature on it is sparse and fragmented. However, MENASEC Applied Security Research posted an entire article, RDP over a Reverse SSH Tunnel, which looks at two different ways to detect this exploit. Because RDP has legitimate use cases, MENA point out in their post why detecting illegitimate RDP can be problematic:
Differentiating between a legit and suspicious RDP activity requires serious RDP baselining especially on large and interconnected networks where multiple parties (vendors, IT Help Desk, Network and System Team etc.) use the same protocol, for legit purposes and in a dynamic way.
First type of suspicious event
The first set of criteria indicating that there might be unauthorized RDP meets these conditions:
-
Event ID 4624 (An account was successfully logged on)
-
Logon Type = 10
-
Source IP address = loopback address (127.0.0.1)
Another possible indicator is when the value for Workstation Name matches that of Account Domain, which the author describes as "very abnormal." However, none of our sample events met this condition, so we will not include it in this query.
To create the chart in the Explore UI we need to choose Table as the Visualization Type, set the following Query options, expand Filters in order to choose WHERE, and use Custom SQL to manually enter the conditions:
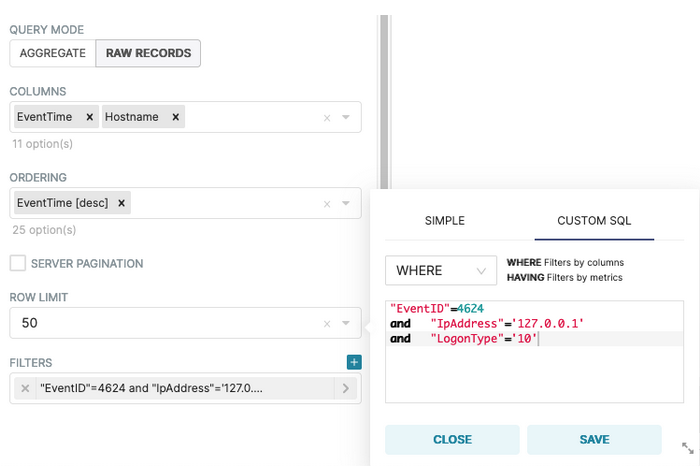
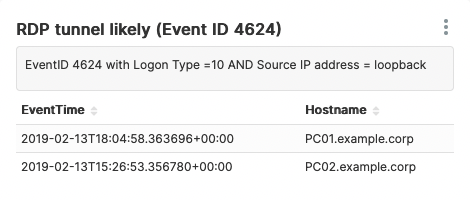
Once the table renders correctly, we can save this configuration as a new Chart named RDP tunnel likely (Event ID 4624), and assign it to the Windows Security dashboard:
Second type of suspicious event
The second set of criteria indicating that there might be unauthorized RDP meets these conditions:
-
Event ID 5156 (The Windows Filtering Platform has permitted a connection)
-
Source IP address = 127.0.0.1 or 127.0.0.2
-
Destination IP address = 127.0.0.1 or 127.0.0.2
-
Source Port or Destination Port = 3389
-
Application used: plink.exe
To create the chart in the Explore UI we need to choose Table as the Visualization Type, set the following Query options, expand Filters in order to choose WHERE, and use Custom SQL to manually enter the conditions:
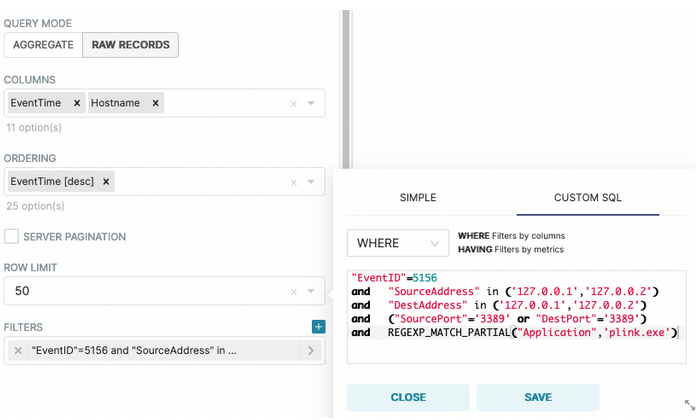
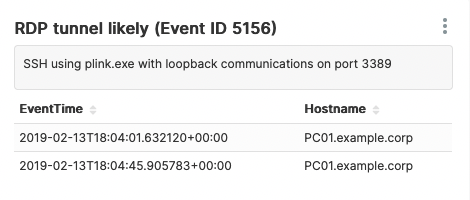
Once the table renders correctly, we can save this configuration as a new Chart named RDP tunnel likely (Event ID 5156), and assign it to the Windows Security dashboard:
Conclusion
It is a rare pleasure when a set of tools resonate with each other as well as these three do. Apache Superset is the perfect complement to Raijin Database Engine while NXLog Enterprise Edition integrates with practically everything! To be able to deploy a solution as complex as this so quickly and hit the ground running within the first hour with meaningful results speaks volumes for this end-to-end solution.
Given the minimum resources required for setting up and testing this integration, we hope you will give it a test drive. If any of the following goals are important to you, we are confident that your team will find that this solution fits in nicely with your current set of tools:
-
Centralized log collection and aggregation of Windows events with an agent that can read any log format, filter, parse, and enrich logs as needed
-
Owning a powerful, log-centric database engine optimized for aggregation queries that can be scaled to the growth of your infrastructure, is free to download, and does not require any costly subscriptions based on GBs of event data ingested
-
Responsive access to your security events via an intuitive UI that speaks SQL — thus leveraging the existing skill set of your team — provides powerful data exploration capabilities, and ad hoc query building, yet allows non-technical roles to create many charts without queries
-
Low or no-latency, on-prem, ingestion of security events in real time without having to share storage or network resources with thousands of other customers
-
A stable UI and backend that only gets updated when your team has fully signed off on the new release candidate that you have downloaded, customized, built, and tested
Useful links
-
Get the latest stable Apache Superset Docker image with built-in support for connecting to Raijin
-
Superset 101: Getting Started - Time Series Charts
-
GitHub repository of Windows Event Log
.evtxfiles containing Samples of Attacks on Windows