
Understanding how NXLog Agent allocates memory is essential to optimize your configuration for performance and utilize system resources efficiently.
NXLog Agent is designed for high-performance log collection and processing and is optimized to use system resources efficiently. However, various external factors affect how NXLog Agent uses system resources, including memory, which can impact NXLog Agent’s and its host’s performance. Misconfiguration is the leading factor we see when troubleshooting excessive memory consumption. Therefore, in this blog post, we will dive deeper into how NXLog Agent allocates memory to help you create the optimal configuration for your system or determine whether high memory usage results from a misconfiguration.
What drives memory consumption up?
A passive NXLog Agent instance uses between 10-20 MB of RAM. However, in reality, the memory it requires depends on the modules in use and the configuration’s complexity. Mainly, two configuration settings determine memory allocation, the LogqueueSize and BufferSize.
- LogqueueSize
-
The log queue size has four main variables:
-
StringLimit sets the maximum size of an event. It defaults to 5 MB.
-
BatchSize sets the maximum number of events in a batch. The default is 50 events.
-
LogqueueSize sets the maximum number of batches NXLog will keep in the queue for each output module. The default is 100 batches.
-
The number of output modules.
-
- BufferSize
-
Input and output modules allocate a buffer per input stream. For example, network input modules, such as im_http, im_ssl, and im_tcp, create a buffer per client connection. File-based inputs, such as im_file, create a buffer for each open file up to the maximum number of active files. The default buffer size is 65,000 bytes.
So, in essence, you can calculate your theoretical maximum memory allocation as follows:
\(StringLimit ∗ BatchSize ∗ LogqueueSize ∗ (NumberOfOutputModules+NumberOfProcessorModules)\)
For example, for a default configuration with one output instance:
\(5242880 * 50 * 100 * 1 = 26214400000B = 24.41GB\)
This calculation basically means:
\(BufferSize * (NumberOfStreams)\)
Which, when translated into numbers, comes down to:
\(65000 * (1+1) = 130000B\)
And taking into account the base NXLog Agent footprint:
\(BaseNXLogFootprint=~20MB\)
The above calculation represents the worst-case scenario for a minimal configuration. Keep in mind that to see this manifest in real life, the following conditions must occur:
-
A full log queue, i.e., a blocked output instance
-
Events equal to the size limit (5 MB by default)
An unobstructed log queue will use little memory. And fortunately, events are usually much smaller and range between 120 bytes and a few hundred kilobytes. So the calculation with 200 KB results in only about 1 GB.
-
What happens in case of memory overuse?
The OS will intervene in some cases. For example, the OoM (Out of Memory) killer will destroy the offending process on Linux. If this happens, NXLog Agent will lose any data in the log queue.
- When is this likely to happen?
-
NXLog Agent allows the log queue to grow until it reaches the LogqueueSize limit if an output instance is blocked. However, if the limit is set too high, it might stress the system’s memory management to the point where an OoM event is triggered.
- How can you distinguish between a memory leak and normal growth?
-
Simultaneously observing the log queue size and memory usage is essential to inspect a potential memory leak. Therefore, the first step is to check the settings and state of the log queue. It will be very hard to spot a leak if you cannot control the LogqueueSize and its inherent variability.
You may observe a monotonic upward trend in memory use, continuing until it plateaus at a maximum value while the log queue fills up. In addition, an OoM event may occur at some point, terminating the NXLog Agent process. However, this is not proof of a memory leak but merely an over-allocation.
Once the log queue is full, memory consumption should stabilize with only minor fluctuations. There may be slight variations during this period, but the overall memory consumption should remain steady. If NXLog Agent never reaches equilibrium, there is a legitimate reason to suspect a memory leak.
NXLog Agent memory usage reaches equilibrium once the log queue is full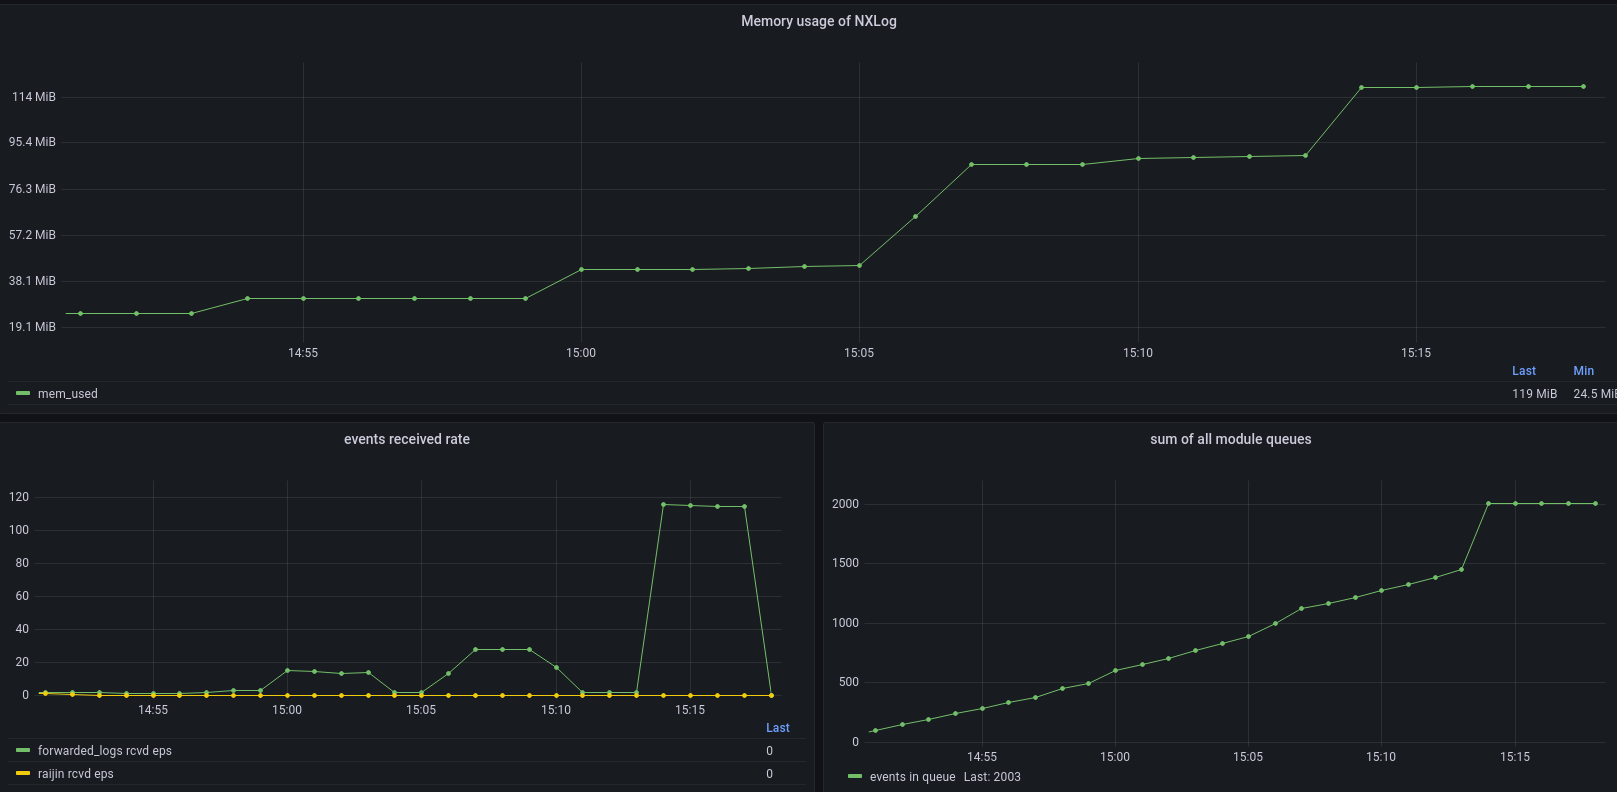
If log processing is unobstructed, your system should reach a steady near-equilibrium state, primarily dependent on the configuration and the event flow. Therefore, you should not see a continuous increase in memory usage.
Memory usage in an unobstructed event flow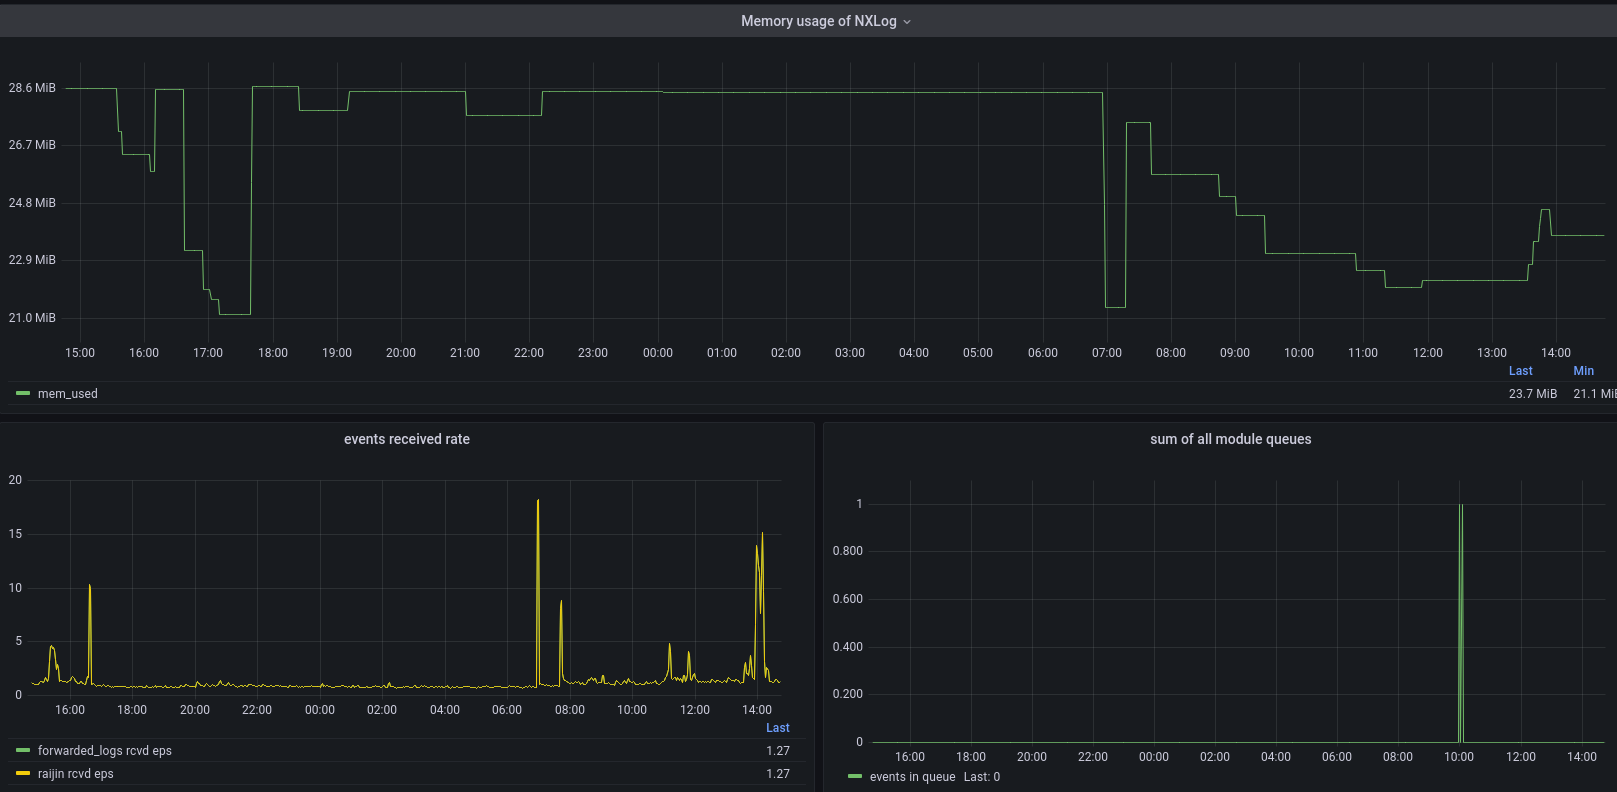
On the other hand, if memory usage grows despite the event flow not being obstructed, it indicates a potential memory leak.
Memory usage grows despite an empty queue and a steady event flow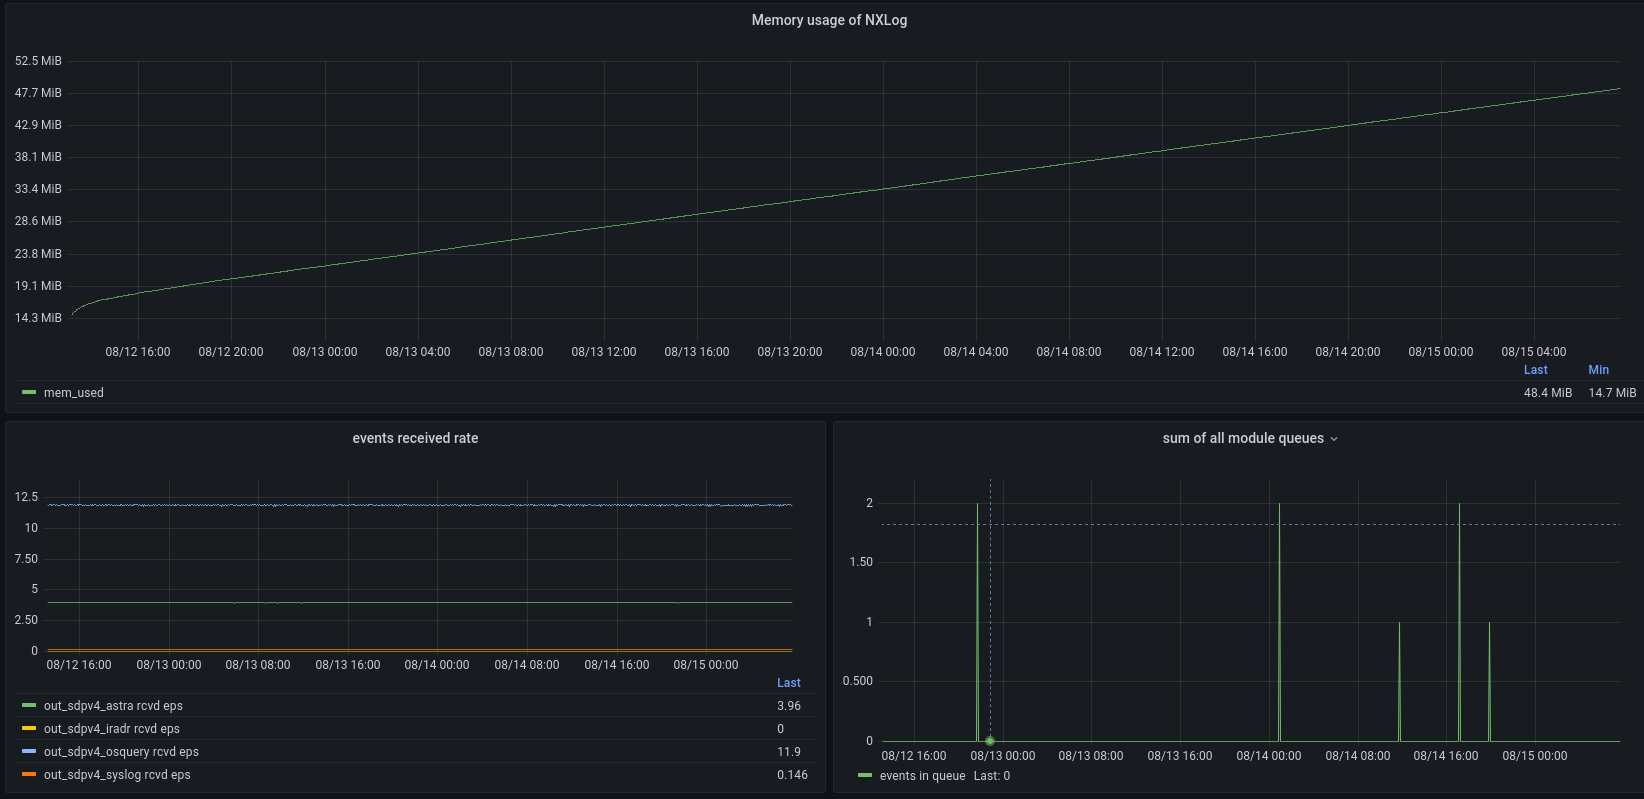
If the memory usage balloons because of an obstructed log queue, it may not be immediately released once it stabilizes.
Memory reallocation after the log queue is emptied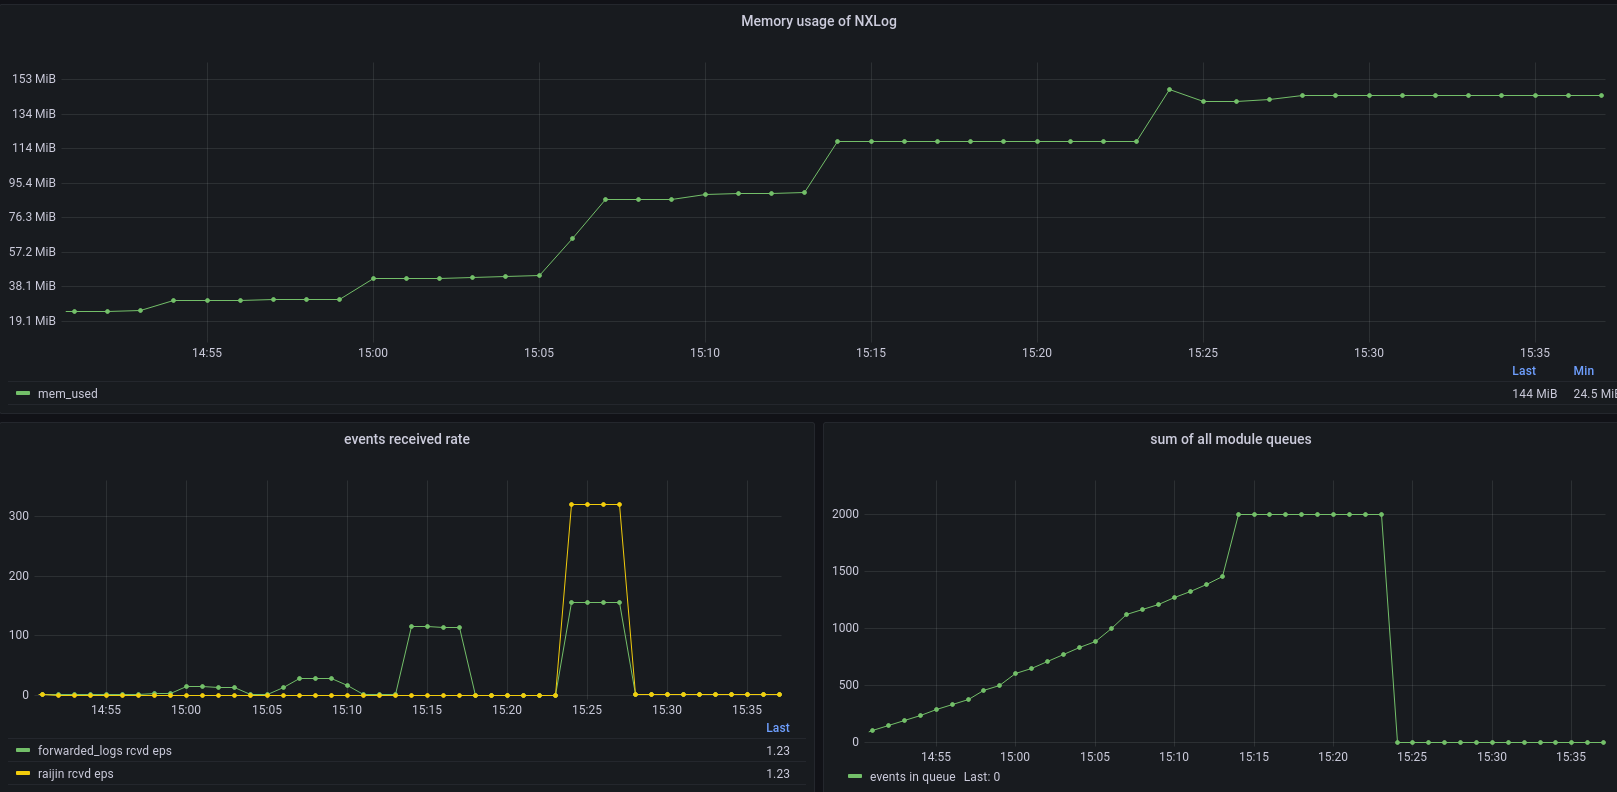
Special cases
- om_kafka
-
om_kafka uses the librdkafka library, which uses a separate message queue. That is an additional memory overhead that you must consider when the module cannot deliver data to the broker.
- pm_buffer
-
pm_buffer supports memory-based buffering. If you enable this, the module uses additional memory apart from the log queue.
Conclusion
In conclusion, there are four factors you must keep in mind when optimizing or troubleshooting NXLog Agent memory consumption:
-
Understand the mechanics - log queue, batch, and event size.
-
Understand the configuration - which modules you’re using, how many output and processor modules you have, and what is the log queue size limit.
-
Understand the events - event size and EPS profile.
-
Understand what to monitor - track memory usage in conjunction with EPS and observe whether there is a monotonic upward trend.
For more information on NXLog Agent’s memory usage, see Configure buffering in the NXLog Platform User Guide.