
Pick the wrong log collector and you pay for it on every node you deploy. A heavier agent multiplied across a thousand hosts is real memory and CPU you can’t get back, and a pipeline wired tightly to one vendor’s backend is hard to unwind later. So the Fluentd vs Logstash decision usually comes down to two questions: how much processing do you need at the collection point, and how committed are you to the Elastic Stack?
Both tools are mature and both move your logs reliably. Fluentd is the lighter, vendor-neutral collector that fans data out to many destinations. Logstash is the heavier transformation engine that pairs most naturally with Elasticsearch. The rest of this article gets specific about where each one wins.
Fluentd vs Logstash at a glance
Every claim in this table is expanded, with sources, in the sections below.
| Dimension | Fluentd | Logstash |
|---|---|---|
License |
Apache 2.0 across all components. |
Apache 2.0 core; X-Pack add-ons under Elastic License 2.0. |
Runtime and idle memory |
Ruby with C extensions; ~40 MB in the one widely cited benchmark. |
JRuby on the JVM; ~120 MB in the same benchmark, plus JVM heap you allocate. |
Current release |
Fluentd 1.19.x; Fluent Package 6.0.2 (Feb 2026 LTS). |
Logstash 9.4.2 (May 2026); ships with a bundled JDK 21. |
Governance |
CNCF graduated project (2019); vendor-neutral. |
Elastic-led; designed around the Elastic Stack. |
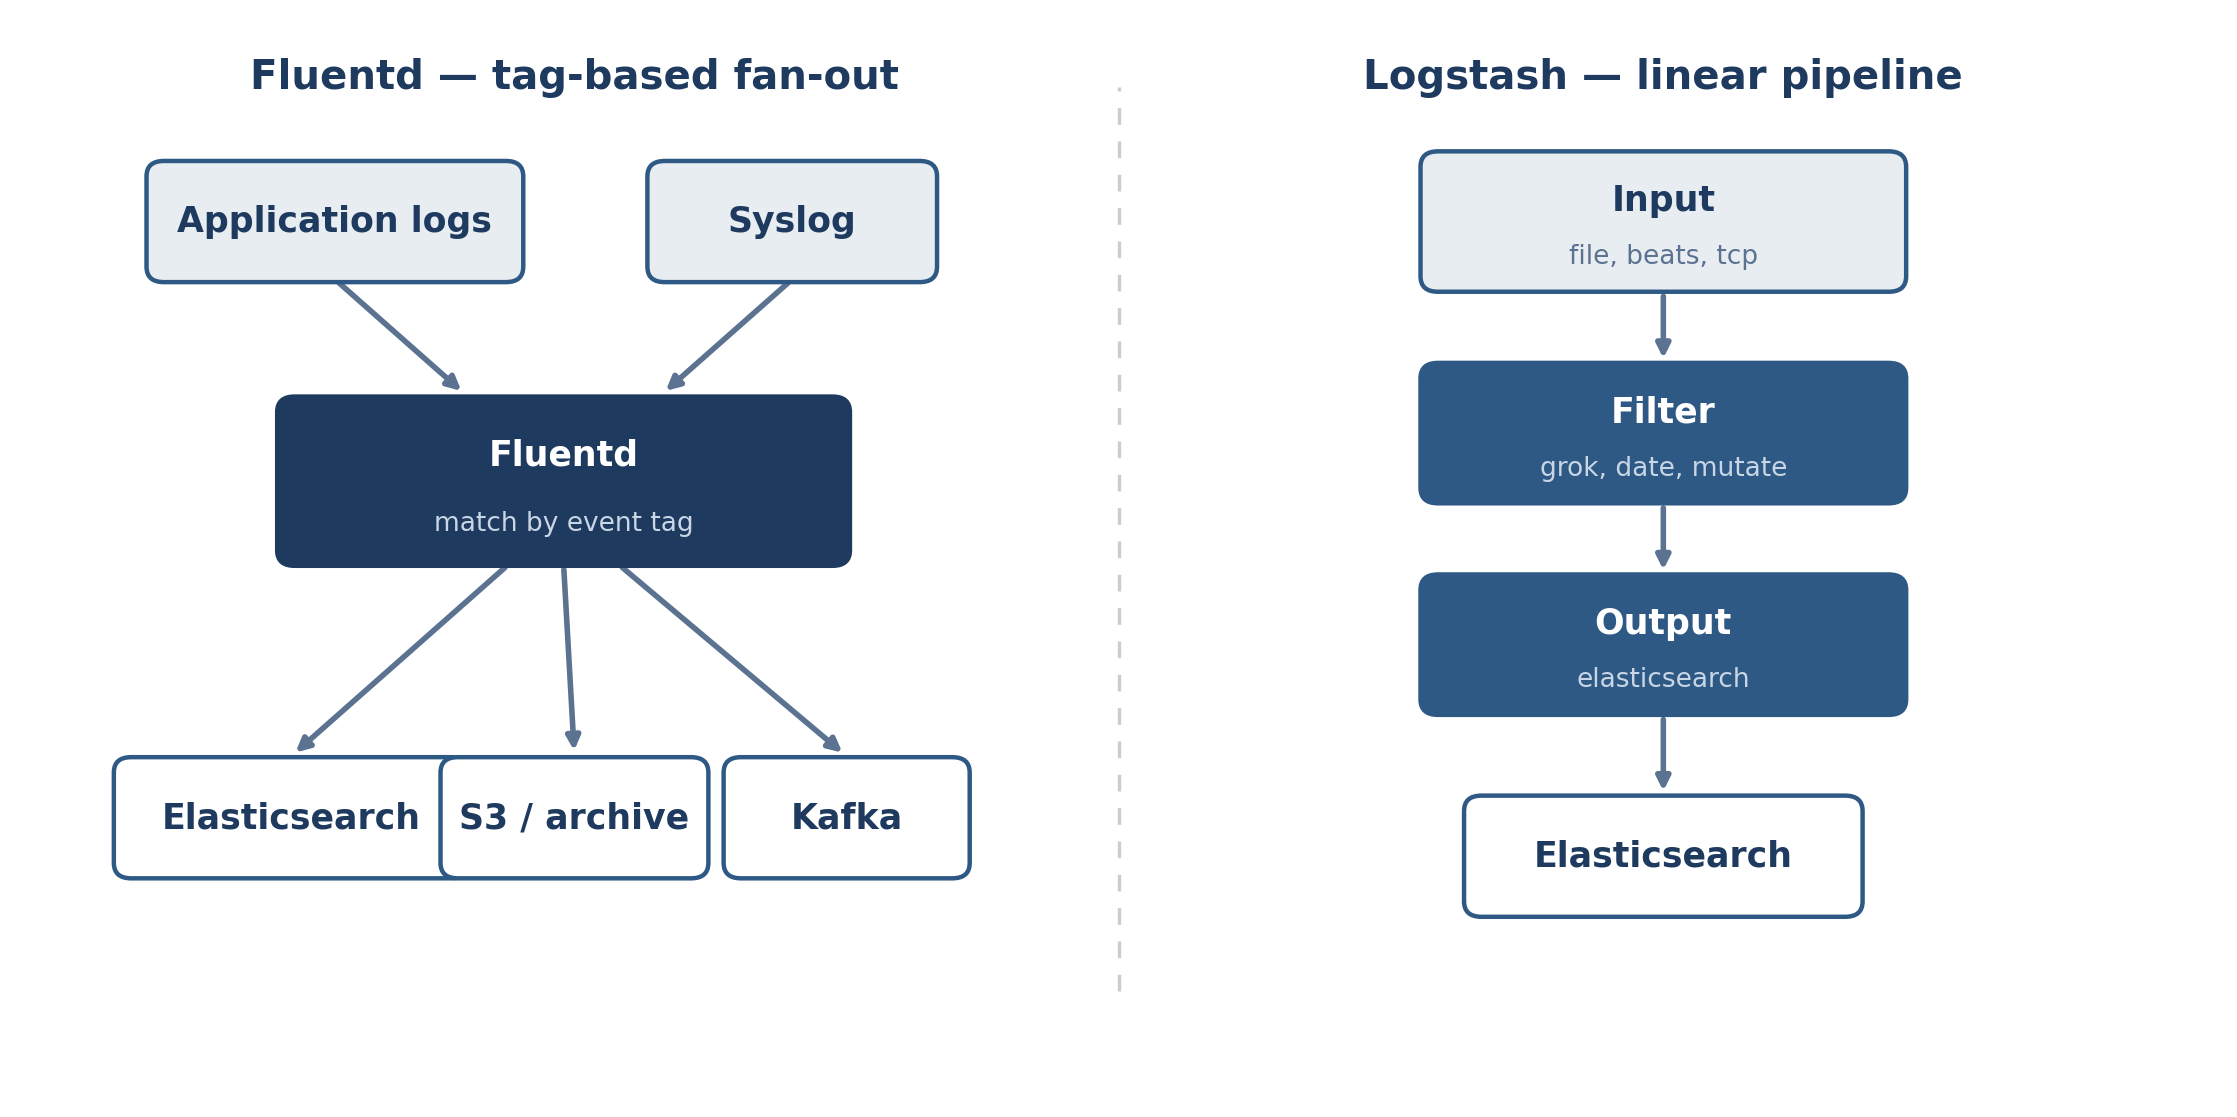
Routing model |
Tag-and-match; fan one stream out to many outputs. |
Linear input → filter → output pipeline. |
Parsing |
Plugin parsers (regexp, JSON, multiline, and more). |
Grok pattern matching plus conditionals; strong on messy text. |
Reliability defaults |
Memory or file buffer; file buffer persists chunks across restarts (opt-in). |
In-memory queue by default. Persistent queue and dead-letter queue are both off by default; the DLQ only catches Elasticsearch-output 400/404 errors. |
Extensibility |
1,000+ community plugins, many third-party destinations. |
200+ plugins; deepest integration is with Elasticsearch and Kibana. |
Fleet management |
No first-party fleet UI; you manage config files per node. |
Centralized pipeline management in Kibana, but it is a paid Elastic subscription feature. |
Sweet spot |
Cloud-native, multi-destination, resource-constrained nodes. |
Heavy transformation feeding Elasticsearch. |
Architecture and deployment
Both tools run as a daemon on the host and follow a collect → process → forward shape, but their internals and their ties to a wider platform differ enough to change how you deploy them.
Fluentd
Fluentd is written in Ruby with C extensions for the hot paths, and every component ships under the Apache 2.0 license. It is a CNCF graduated project (graduated 2019) maintained by ClearCode and the community, with no single commercial owner gating features. The current core is Fluentd 1.19.x, distributed through Fluent Package 6.0.2, the February 2026 LTS build, with 6.0.3 due mid-2026.
Internally, every record is a tagged, structured event — typically JSON — and you route it by matching on its tag. Output plugins group events into buffer chunks that move from a staging area to a queue before they ship. You deploy Fluentd self-managed: deb/rpm/msi packages, a Docker image, or a Kubernetes DaemonSet. There is no hosted Fluentd service; commercial support comes from ClearCode and Treasure Data rather than a SaaS console. For the smallest nodes, the same project ships Fluent Bit, a sub-megabyte collector in C that speaks the same forward protocol.
A minimal Fluentd config is a tagged source and a tag-matched output that buffers to disk for durability:
<source>
  @type tail
  path /var/log/app/*.log
  pos_file /var/log/fluentd/app.pos
  tag app.access
  <parse>
    @type json
  </parse>
</source>

# Any event tagged app.** is routed here
<match app.**>
  @type elasticsearch
  host elasticsearch.internal
  port 9200
  <buffer>
    @type file # survives a restart
    path /var/log/fluentd/buffer/es
    flush_interval 5s
    retry_max_times 10
  </buffer>
</match>
Logstash
Logstash runs on the JVM (its codebase is roughly half Java, half Ruby) and ships as part of the Elastic Stack. The current release is Logstash 9.4.2 (May 2026), and the distributed packages bundle their own JDK 21, so you don’t install Java separately. Deployment is self-managed by default — deb/rpm, Docker, or the Elastic Cloud on Kubernetes (ECK) operator — since Elastic’s hosted Cloud service runs Elasticsearch and Kibana rather than Logstash itself.
The same job in Logstash is three explicit stages — input, filter, output — with Grok doing the parsing in the middle:
input {
  file {
    path => "/var/log/app/*.log"
    start_position => "beginning"
  }
}

filter {
  grok {
    match => { "message" => "%{COMBINEDAPACHELOG}" }
  }
  date {
    match => [ "timestamp", "dd/MMM/yyyy:HH:mm:ss Z" ]
  }
}

output {
  elasticsearch {
    hosts => ["http://elasticsearch.internal:9200"]
    index => "app-%{+YYYY.MM.dd}"
  }
}
Here is the licensing point that trips people up, stated once: the 2021 relicensing to SSPL and the Elastic License applied to Elasticsearch and Kibana, not to Logstash. Logstash’s core stayed Apache 2.0; only its X-Pack add-ons moved to Elastic License 2.0. "Logstash is no longer open source" is wrong as written — the core is still Apache 2.0, and a handful of features are not.
One deployment note that cuts across both tools: if your fleet mixes Windows, Linux, macOS, and network gear, you can normalize collection upstream with an agent layer like NXLog Platform, which manages a single agent across those operating systems and forwards to whichever backend you choose. That keeps the Fluentd-or-Logstash choice focused on processing and storage rather than on per-OS collection.
Where the numbers actually exist
Be skeptical of confident benchmark claims here, because hard, recent, independent data is thin. The most widely quoted figure traces to a 2015 OpenStack Summit talk summarized by Logz.io: both tools sustained 10,000+ events per second, while Fluentd used about 40 MB of memory against Logstash’s roughly 120 MB. That is the number everyone cites, and it is a decade old, with test conditions that were never published in detail. Treat it as directional, not definitive.
The footprint gap is small on a single modern box. It stops being small at fleet scale: the same 80 MB difference across 1,000 collection nodes is about 80 GB of memory spent before you have processed anything. That arithmetic, not the raw per-node number, is the real argument for a lighter agent at the edge — and it is why teams often pair Logstash with lightweight shippers rather than running it on every leaf node.
For "ease of use," skip the impressions and count the moving parts. A minimal Fluentd setup is one config file and the plugins you install as gems. A minimal Logstash pipeline is also one config, but the input-filter-output stages and Grok patterns carry a steeper learning curve, and a production setup usually assumes Elasticsearch and Kibana are already standing. Fluentd asks you to think in tags; Logstash asks you to think in pipeline stages.
Features that change the decision
Neither tool gives you search, dashboards, or alerting on its own — those live downstream in Elasticsearch and Kibana, Grafana, or whatever you forward to. So the features worth comparing are the ones inside the pipeline: how each tool transforms, routes, survives failure, and extends.
On transformation, Logstash is the stronger engine. Grok plus conditionals is built for pulling structure out of unstructured text, and that is the main reason teams accept its weight. Fluentd parses well through plugins, but heavy enrichment is where Logstash earns its keep. If your raw logs are messy and you need them structured before storage, that gap matters; if you mostly collect already-structured events and route them, it largely doesn’t. An upstream agent such as NXLog Agent that comes with NXLog Platform can also do field extraction and normalization before either tool sees the data, which shifts where you spend that effort.
On reliability, read the defaults carefully. Fluentd’s file buffer persists chunks to disk, so in-flight data survives a restart — but you have to choose the file buffer, since memory buffering drops un-flushed data on shutdown. Logstash uses an in-memory queue by default; its persistent queue and dead-letter queue are both off until you enable them. The DLQ has a sharp limit worth knowing before you rely on it: it only captures events the Elasticsearch output rejects with a 400 or 404 (plus events that fail conditional evaluation), not events lost because a destination is unreachable. If your destination isn’t Elasticsearch, the DLQ does nothing for you.
On extensibility, Fluentd’s 1,000+ community plugins point in many directions, which suits sending the same data to several unrelated destinations. Logstash’s ~200 plugins are fewer but its Elasticsearch and Kibana integration is first-class and well documented. The asymmetry is the honest summary: Fluentd is broader, Logstash is deeper into one stack.
On managing a fleet, there is a real paid-tier line. Logstash offers centralized pipeline management — edit and push pipelines to many instances from Kibana — but it is an Elastic subscription feature, not part of the free tier. Fluentd has no first-party equivalent; you manage configs per node or lean on your own automation.
Scenarios and the better fit
Concrete situations make the tradeoffs land faster than feature lists.
- Kubernetes platform, ~500 nodes, mostly structured JSON logs, routed to two backends
-
Fluentd (or Fluent Bit as a DaemonSet, with Fluentd aggregating). The per-node footprint and vendor-neutral fan-out are exactly what this needs, and there is little heavy parsing to justify Logstash’s weight.
- Mid-size SOC, ~200 GB/day, raw firewall and app logs that need structuring before indexing into Elasticsearch
-
Logstash. Grok-heavy enrichment into Elasticsearch is its home turf, and the team is already in the Elastic Stack.
- Edge or IoT collection on memory-constrained hardware
-
Fluent Bit at the edge feeding Fluentd. Running a JVM on these nodes is the wrong tool; the ~80 GB-per-1,000-nodes math becomes decisive.
- Heterogeneous enterprise fleet: Windows Event Log, Linux syslog, and network appliances
-
Normalize collection with a cross-OS agent first, then forward to either tool. The hard part here is consistent collection across platforms, not the processing engine — and an agent layer like NXLog Platform removes the per-OS config sprawl before Fluentd or Logstash even enters the picture.
- Small team that wants to push pipeline changes to many collectors from one console
-
Logstash, if you pay for the Elastic subscription that unlocks centralized pipeline management. Without that license, neither tool gives you a managed control plane out of the box, and Fluentd expects you to bring your own automation.
The recommendation
If you live in the Elastic Stack and your logs need real structuring before they land, choose Logstash. Grok, conditionals, the DLQ for Elasticsearch failures, and centralized pipeline management form a coherent package — provided you budget for the JVM footprint and the subscription that unlocks fleet management.
If you run cloud-native infrastructure, route to more than one backend, or care about per-node resource cost, choose Fluentd, with Fluent Bit at the edge. Apache 2.0 across the board, CNCF governance, and a broad plugin set make it the safer long-term bet when you don’t want to be tied to one analytics vendor.
On enterprise readiness and compliance, the deciding factors are concrete: Logstash’s audit-friendly features and managed pipelines sit behind a paid license, while Fluentd’s clean Apache 2.0 licensing is the easier story for procurement. On deployment complexity, Fluentd is lighter to stand up and operate; Logstash repays its heavier setup only when you genuinely need its transformation depth. Map your situation to those lines and the choice is rarely a coin toss.
FAQ
- Should I use Fluent Bit instead of Fluentd?
-
Use Fluent Bit when memory is tight or you only need collection and light processing at the edge; use Fluentd as the aggregator when you need its larger plugin set and more complex routing. They are designed to work together, not as either/or.
- Is Elastic Agent a reason to skip Logstash?
-
Sometimes. For straightforward shipping into Elasticsearch, Elastic Agent with Fleet can replace a Beats-plus-Logstash chain. Logstash still earns its place when you need transformation that Agent’s processors can’t do, or you’re routing to non-Elastic destinations.