Server log analysis turns the raw event records your Windows and Linux servers already produce into security detections, audit evidence, and troubleshooting answers. NXLog Agent and NXLog Platform provide that pipeline: collection and parsing at the source, centralized storage and search on top.
Every server you run writes down what happens to it: who logged in, which services started, what the web server returned, why a process crashed. Attackers know this too. That’s why techniques for clearing Windows Event Logs and disabling event logging have their own entries in the MITRE ATT&CK knowledge base. Logs are often the only evidence that something went wrong.
In this post, we’ll walk you through the full server log analysis workflow: where server logs live, how to collect and parse them, which events to monitor, how to design a source-to-SIEM architecture, and how to troubleshoot with logs when something breaks. You’ll also get ready-to-adapt NXLog Agent configuration examples to test in your own environment.
What is server log analysis?
Server log analysis is the practice of collecting, parsing, and examining the event records that servers generate (operating system events, authentication attempts, service activity, and application output) to detect security threats, satisfy compliance requirements, and diagnose operational problems. It builds on log management, which NIST SP 800-92 (Kent & Souppaya, 2006) defines as the process of generating, transmitting, storing, analyzing, and disposing of log data.
A quick clarification of terms, because they get mixed up often:
-
Log management is the operational discipline: generating, moving, storing, and eventually disposing of log data. NIST is currently revising its guidance in the draft SP 800-92 Rev. 1 (Scarfone & Souppaya, 2023 — still an initial public draft as of this writing).
-
Log monitoring is the continuous, automated part: watching incoming logs and alerting when defined conditions occur.
-
Log analysis covers both real-time monitoring and after-the-fact investigation — correlating events across systems, reconstructing incidents, and finding root causes.
You need all three. The rest of this guide shows you how to build them for server logs specifically.
Why server log analysis matters
- Detection depends on it
-
Intrusions that rely on living-off-the-land techniques — legitimate tools already present on the system — leave few artifacts other than log entries. That’s the core argument of Best Practices for Event Logging and Threat Detection, the joint guidance released in August 2024 by the Australian Signals Directorate’s ACSC together with CISA, the FBI, the NSA, and international partners. If you don’t collect and analyze server logs, these attacks are close to invisible.
- Detection is still slow
-
The IBM Cost of a Data Breach Report 2026, based on research by the Ponemon Institute covering more than 600 organizations breached between March 2025 and February 2026, puts the mean time to identify and contain a breach at 247 days — reversing five straight years of decline, and still roughly eight months of undetected attacker activity. Well-instrumented server logging shortens that window, because the evidence of initial access usually lands in a server log first.
- Auditors expect it
-
PCI DSS v4.0.1 Requirement 10 mandates logging and daily review of security events, and Requirement 10.5.1 requires you to keep audit log history for at least 12 months, with the most recent three months immediately available for analysis. The CIS Critical Security Controls v8.1 dedicate Control 8 entirely to audit log management — collection, centralization, retention, and review. The HIPAA Security Rule requires audit controls that record and examine activity in systems containing electronic protected health information.
- Operations teams need it too
-
The same pipeline that catches a brute-force attack also tells you why a service crashed at 3 a.m. Building one pipeline that serves security, compliance, and operations is cheaper than building three.
Types of server logs and where to find them
Before you can analyze anything, you need to know what your servers write and where. Here are the log sources that matter most, by platform.
Windows server logs
Windows records events in Windows Event Log, stored as .evtx files under %SystemRoot%\System32\winevt\Logs\ and viewable with Event Viewer (eventvwr.msc).
The three classic channels are Security (authentication and audit events), System (services, drivers, kernel), and Application (software-level events).
Server roles add their own channels under Applications and Services Logs — we covered the Remote Desktop channels in detail in our guide to RDP logging and monitoring.
These Security and System events deserve a permanent place on your watchlist:
| Event ID | Channel | What it tells you |
|---|---|---|
Security |
Successful logon. The Logon Type field distinguishes console, network, and remote interactive sessions. |
|
Security |
Failed logon, including a Status/Sub Status code explaining why. Bursts of 4625 events signal brute-force activity. |
|
4672 |
Security |
Special privileges assigned at logon — in practice, an administrative logon. |
4688 |
Security |
New process created. With command-line auditing enabled, it captures the full command line. |
4720 / 4732 |
Security |
User account created / member added to a security-enabled local group. Watch for additions to Administrators. |
4740 |
Security |
Account locked out — the aftermath of repeated failed logons. |
Security (interestingly, the provider for this one is actually |
The audit log was cleared. There is almost no benign reason to see this outside planned maintenance. |
|
7045 |
System |
A new service was installed — a classic persistence mechanism. |
Microsoft maintains a longer prioritized list in Appendix L: Events to Monitor. For a broader treatment of Windows security events, see our post on security event logs.
Linux server logs
Linux servers split their logging between flat files and the systemd journal:
| Location | Distribution family | Contents |
|---|---|---|
|
Debian, Ubuntu |
Authentication events: SSH logons, |
|
RHEL, CentOS, Fedora |
The same authentication events on Red Hat-family systems. |
|
Debian, Ubuntu |
General system messages. |
|
RHEL family |
General system messages. |
|
Debian, Ubuntu |
Kernel messages, including out-of-memory killer activity. |
systemd journal |
All systemd distributions |
Structured, indexed logs from units and the kernel, managed by systemd-journald and read with |
Under RHEL 8/9, the /var/log/* text files coexist with journald data.
|
For deeper audit trails such as file access, syscalls, and identity changes, the Linux Audit framework (auditd) is the source of record.
Our Linux Audit integration guide shows how to collect it.
We also walk through a complete detection setup in Linux security monitoring with NXLog Platform.
Web, application, and database server logs
Server log analysis doesn’t stop at the operating system. The services running on your servers keep their own records:
| Server | Default logs | Reference |
|---|---|---|
Apache HTTP Server |
|
|
nginx |
|
|
Microsoft IIS |
W3C extended format files under |
|
MySQL |
Error log, plus optional general query and slow query logs |
|
PostgreSQL |
Server log via the logging collector, format and destination configurable |
If IIS makes up a large share of your servers, we compared tooling approaches in our post on enterprise IIS log analysis.
The server log analysis process: six steps
Effective server log analysis is a pipeline, not a product. Here is the workflow we recommend. It maps closely to the lifecycle described in NIST SP 800-92 and the ACSC/CISA joint guidance:
-
Define scope and write a logging policy. Decide which servers, channels, and files are in scope, what quality of event you need (timestamps, source identifiers, user context), and how long you must keep everything. The joint guidance recommends an enterprise-approved logging policy as the first step, before any tooling decisions.
-
Collect from every in-scope server. Deploy a collection agent, or configure forwarding for systems that can’t run one. Gaps in coverage become gaps in your investigation timeline.
-
Centralize over an encrypted transport. Logs left on the host are logs an attacker can delete. Move them off-server in near real time, over TLS, to central storage.
-
Parse and normalize. Convert free-text lines and XML events into structured records with consistent field names, so one query works across Windows, Linux, and application sources.
-
Correlate, monitor, and alert. Define the conditions that matter — failed-logon bursts, cleared audit logs, new services — and alert on them automatically.
-
Retain, review, and tune. Store logs for your required retention period, review them on a schedule, and keep adjusting what you collect and what you alert on.
The rest of this guide works through steps 2-6 in practice.
Source-to-SIEM architecture patterns
How log data travels from your servers to your analytics layer shapes everything else: cost, reliability, and how much of the network you expose. Two patterns cover most environments.
Pattern 1: direct agent-to-SIEM
Each server runs a collection agent that parses, filters, and forwards events straight to your SIEM or to NXLog Platform.
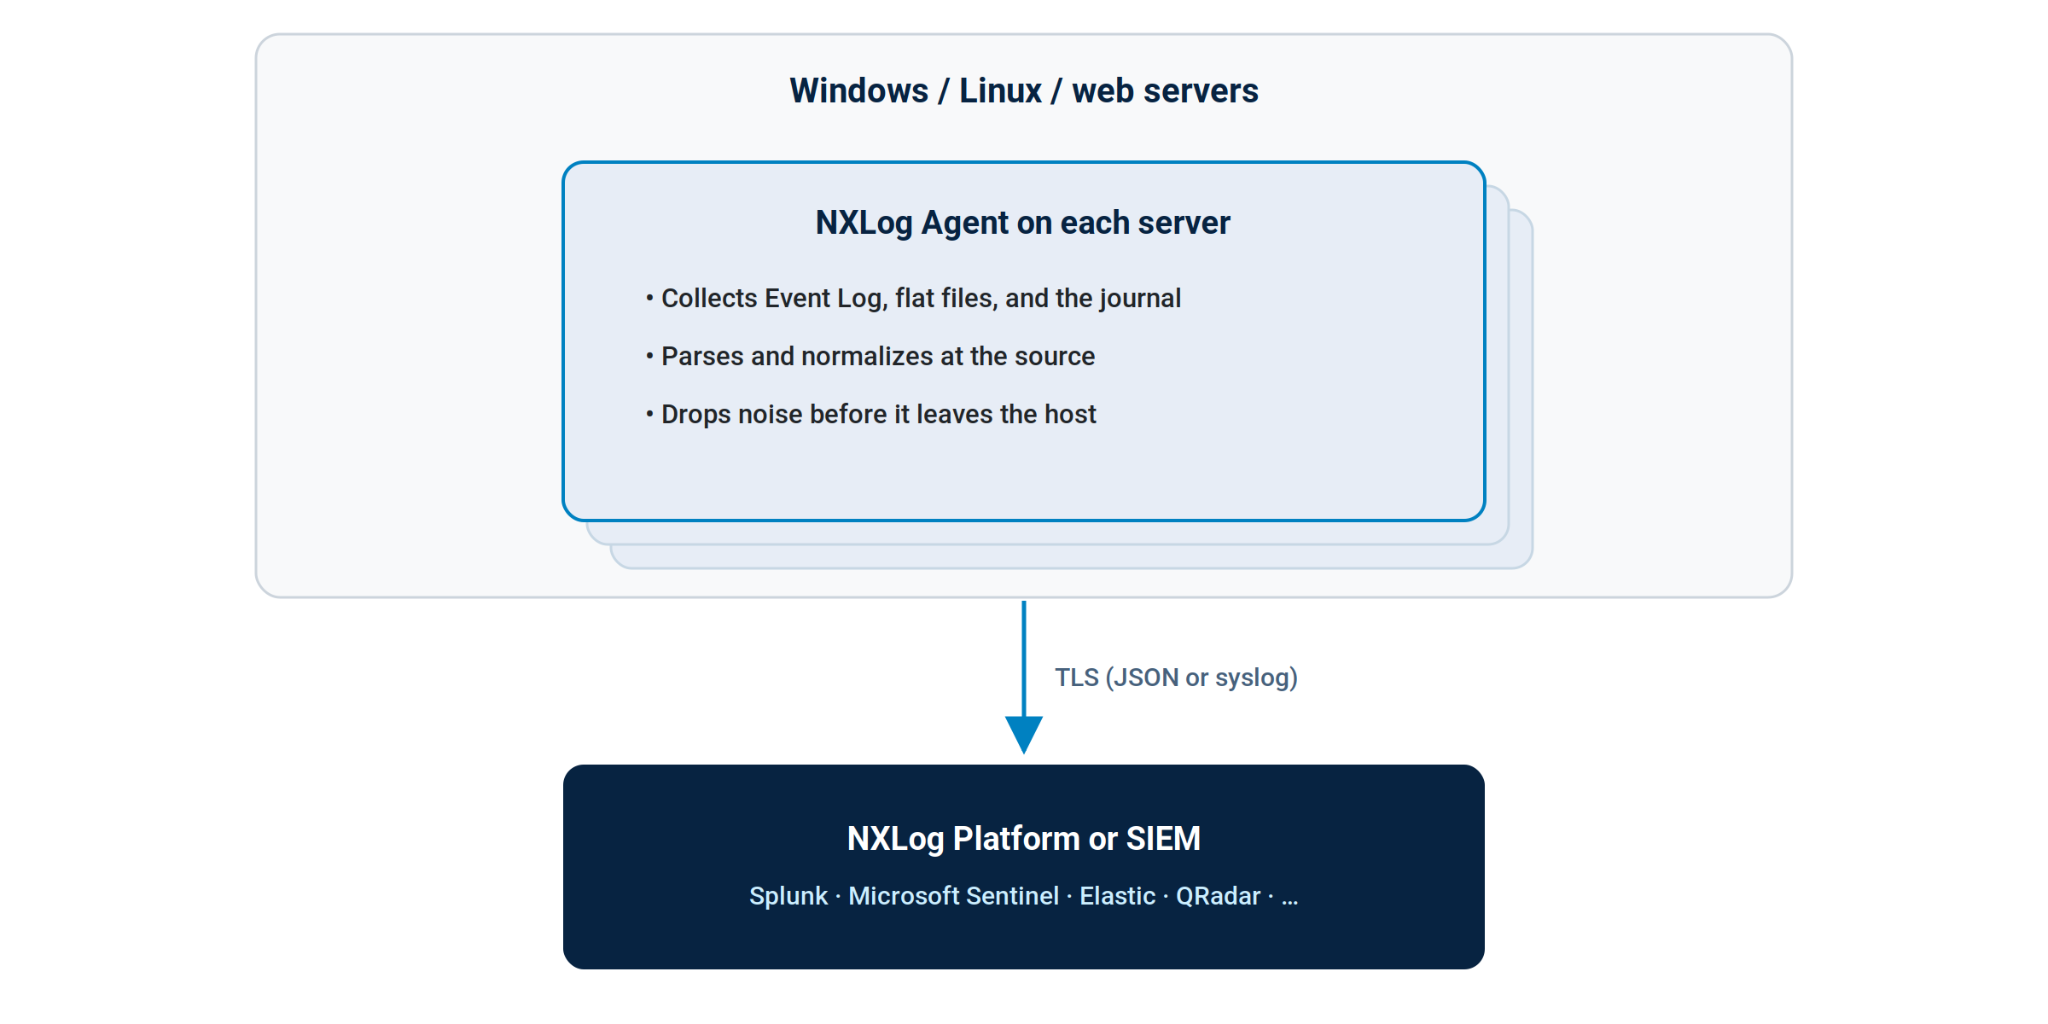
This is the simplest design and works well for flat networks and small-to-medium fleets. Its main strength is on-source processing: because filtering and normalization happen on the endpoint, your SIEM bill reflects signal rather than raw volume.
Pattern 2: tiered collection with a relay
Segmented networks, DMZs, branch offices, and appliance-heavy environments usually need an intermediate tier. Edge agents ship to a relay; the relay buffers, enriches, and forwards upstream. Devices that can’t run an agent — switches, firewalls, storage arrays — send syslog to the same relay.
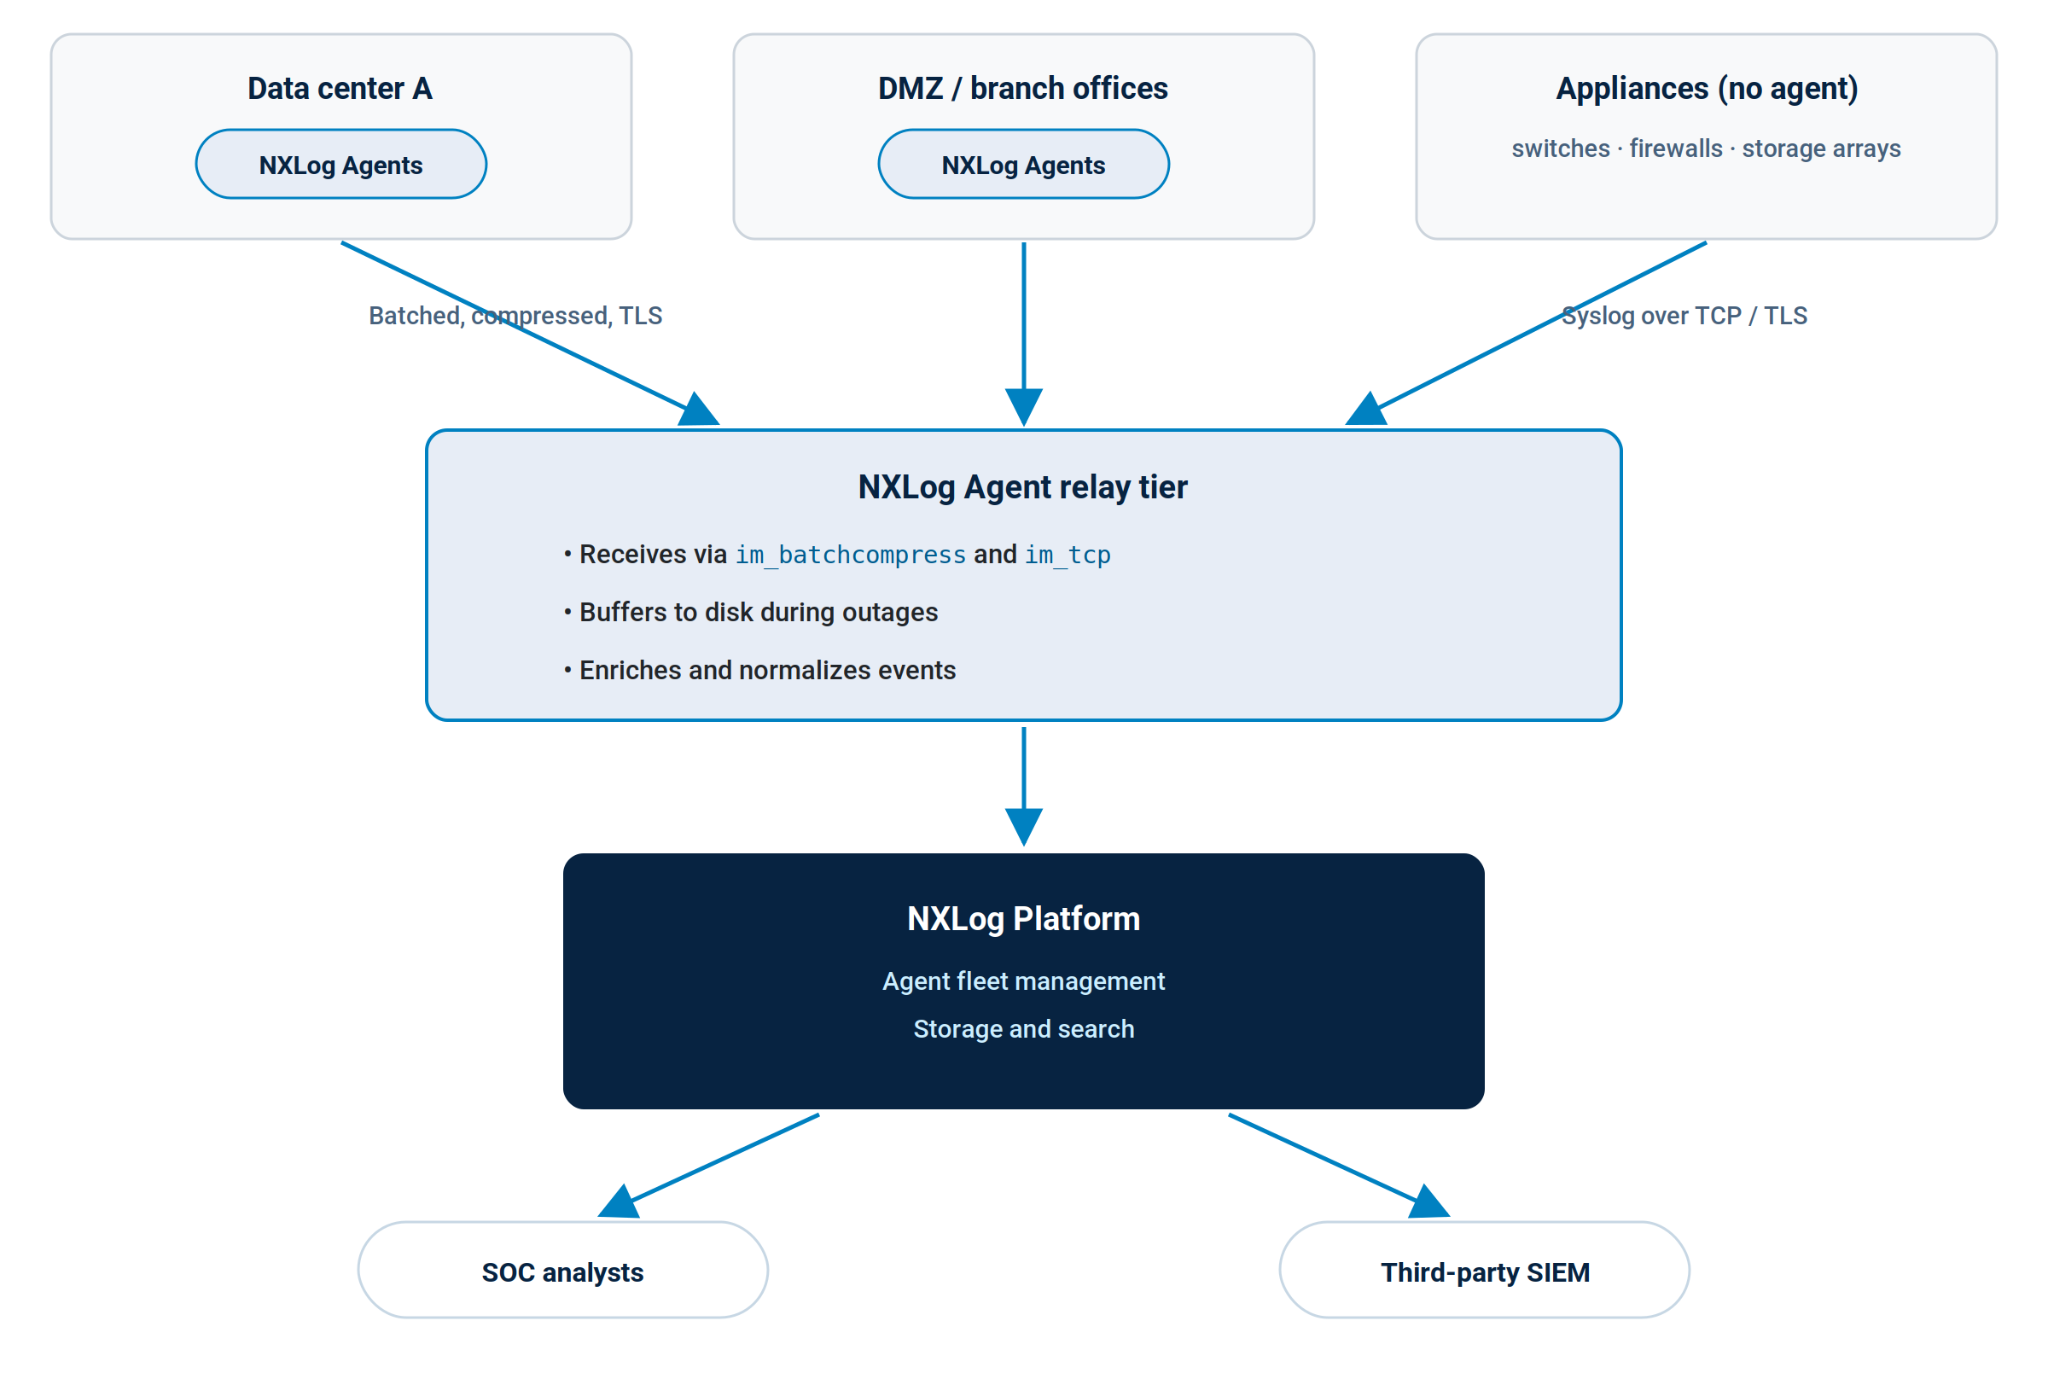
A few notes on the building blocks:
- Relay transport
-
NXLog Agent instances can exchange batched, compressed event data using the NXLog transport output and input module pair, which also supports TLS. Plain TCP and UDP input modules handle syslog from agentless devices.
- Buffering
-
The Buffer processor module adds disk-backed buffering, so a SIEM outage or WAN blip doesn’t drop events.
- Agentless Windows collection
-
Where you can’t install agents on every Windows host, NXLog Agent can act as a Windows Event Collector input module — see the Windows Event Forwarding integration guide.
Whichever pattern you choose, keep one rule constant: the security-relevant events leave each server within seconds, encrypted, and land somewhere the server’s own administrator account can’t erase them.
Configuration example: collecting server logs
The examples below use NXLog Agent’s configuration language. They’re starting points, not drop-in production configs — please test them in a lab first and adjust paths, hostnames, and certificates for your environment. Installation guides for Windows, RHEL, Debian/Ubuntu, and other platforms are in the NXLog Agent Reference Manual.
Example 1 — Windows Security events, filtered at the source
The Event Log for Windows input module reads Windows Event Log natively.
Filtering with a QueryXML block is more efficient than collecting everything and dropping events afterwards, because the subscription itself only returns matching events.
This example collects the high-value Security events from the table above, plus new-service installations from the System channel:
<Input windows_security>
    Module              im_msvistalog
    <QueryXML>
        <QueryList>
            <Query Id="0">
                <Select Path="Security">
                    *[System[(EventID=4624 or EventID=4625 or EventID=4672
                    or EventID=4688 or EventID=4720 or EventID=4732
                    or EventID=4740 or EventID=1102)]]
                </Select>
                <Select Path="System">
                    *[System[Provider[@Name='Service Control Manager']
                    and (EventID=7045)]]
                </Select>
            </Query>
        </QueryList>
    </QueryXML>
</Input>
im_msvistalog parses each event into structured fields ($EventID, $Channel, $TargetUserName, and so on) automatically.
The Windows Event Log integration guide covers remote collection, custom channels, and more advanced query patterns.
Example 2 — Linux authentication and system logs
On Linux, the File input module tails flat log files, and the Syslog extension module parses the syslog format into fields:
<Extension syslog>
    Module    xm_syslog
</Extension>

<Input linux_auth>
    Module    im_file
    File      '/var/log/auth.log' (1)
    Exec      parse_syslog();
</Input>

<Input linux_system>
    Module    im_file
    File      '/var/log/syslog' (2)
    Exec      parse_syslog();
</Input>| 1 | Use /var/log/secure on RHEL-family systems. |
| 2 | Use /var/log/messages on RHEL-family systems. |
For servers where the systemd journal is the primary log store, the Systemd input module reads structured journal entries directly, and the Linux Audit System input module collects from the Linux Audit framework without requiring auditd.
The Linux system logs integration guide compares the options.
Configuration example: parsing and normalizing
Raw log lines are cheap to store and expensive to query.
Parsing turns them into structured records; normalizing gives those records consistent field names across sources, so $SourceIP means the same thing whether the event came from sshd, IIS, or a firewall.
The formats you’ll deal with on servers:
-
Syslog comes in two flavors: the legacy BSD format described in RFC 3164 and the current IETF standard, RFC 5424. NXLog Agent’s Syslog extension module parses and generates both — see the syslog integration guide.
-
JSON is the format most downstream systems expect; the JSON extension module converts records to and from it.
-
W3C extended format covers IIS and similar sources via the W3C extension module.
-
CEF and LEEF, common SIEM interchange formats, are handled by the Common Event Format and LEEF extension modules.
-
Free-text application logs yield to regular expressions, the Grok extension module’s patterns, or the Multiline Parser extension module for stack traces.
Example 3 — Apache access logs to structured fields
This input tails an Apache access log in Combined Log Format and extracts every field, converting the timestamp and status code to proper types along the way:
<Input apache_access>
    Module    im_file
    File      '/var/log/apache2/access.log'
    <Exec>
        if $raw_event =~ /^(\S+) (\S+) (\S+) \[([^\]]+)\] "(\S+) (\S+) (\S+)" (\d+) (\S+) "([^"]*)" "([^"]*)"$/
        {
            $SourceIP    = $1;
            $Ident       = $2;
            $AuthUser    = $3;
            $EventTime   = strptime($4, "%d/%b/%Y:%H:%M:%S %z");
            $HTTPMethod  = $5;
            $HTTPURL     = $6;
            $HTTPVersion = $7;
            $HTTPStatus  = integer($8);
            $BytesSent   = $9;
            $Referrer    = $10;
            $UserAgent   = $11;
        }
        else drop(); (1)
    </Exec>
</Input>| 1 | Discard lines that don’t match the Combined format. |
The Apache HTTP Server integration guide extends this to error logs and alternative formats; there are matching guides for nginx and Microsoft IIS.
Configuration example: filtering, forwarding, and monitoring
Cut noise at the source — carefully
On-source filtering is the biggest lever you have against SIEM ingestion cost. But filtering security telemetry is a risk decision, not just a cost one: what you drop, you can’t investigate later. A defensible pattern is to keep authentication and audit events at full fidelity while trimming high-volume operational sources. For example, in a web pipeline where only errors feed detections:
if defined($HTTPStatus) and $HTTPStatus < 400 drop(); (1)| 1 | Optional, inside the apache_access Exec block: keep client and server errors, drop successful requests. |
Document every drop rule in your logging policy, and revisit it when your detection needs change. Our cost reduction page covers this trade-off in more depth.
Example 4 — Forward everything over TLS
This output converts records to JSON and ships them over TLS to NXLog Platform or any syslog/TLS-capable SIEM, then a route ties the pipeline together:
define CERTDIR /opt/nxlog/etc/cert (1)

<Extension json>
    Module    xm_json
</Extension>

<Output siem_tls>
    Module    om_ssl
    Host      logs.example.com:6514
    CAFile    %CERTDIR%/ca.pem
    Exec      to_json();
</Output>

<Route servers_to_siem>
    Path      windows_security, linux_auth, linux_system, apache_access => siem_tls
</Route>| 1 | Adjust for your platform. |
If your destination has a native protocol, swap the output module rather than forcing everything through syslog: NXLog Agent ships purpose-built output modules including Elasticsearch, Microsoft Sentinel, Google Security Operations, and Kafka, with step-by-step integration guides for Splunk, Microsoft Sentinel, and other SIEMs.
What to monitor and alert on
Whatever your analytics layer, these server-side signals earn real-time alerts. They map directly to attacker behavior cataloged in MITRE ATT&CK and to Microsoft’s events-to-monitor guidance:
| Signal | Windows evidence | Linux evidence | Why it matters |
|---|---|---|---|
Failed-logon bursts |
Repeated 4625, then 4740 lockouts |
Repeated |
Brute-force or password-spray activity |
Audit trail interference |
1102 (log cleared), auditing service stopped |
|
|
New persistence points |
7045 (new service), 4698 (scheduled task) |
New |
Attackers making access survive a reboot |
Privilege changes |
4720, 4732 (account created, added to admins) |
New |
Privilege escalation and backdoor accounts |
Off-pattern admin logons |
4624 Logon Type 10 at odd hours or from unknown IPs |
SSH logons from new source addresses |
Compromised credentials in use |
Service instability |
Service Control Manager errors such as 7031/7034 |
Repeated unit restarts in the journal |
Crashes, misconfigurations — or tampering |
For correlation logic that needs to run before events reach the SIEM — "alert if X happens more than N times within M seconds" — the agent-side Event Correlator processor module handles thresholds, suppression, and paired events. Once data lands in NXLog Platform, you can search it centrally and build dashboards; we showed how in visualizing telemetry data flow and volume with NXLog Platform.
Troubleshooting with server logs
Analysis isn’t only about attackers. Here are three troubleshooting workflows where centralized server logs pay for themselves.
Failed logons that aren’t attacks
A spike in 4625 events looks like a brute-force attempt until you read the Sub Status field: 0xC000006A means a wrong password, 0xC0000234 a locked account, 0xC0000072 a disabled one.
The full code list is on the event 4625 reference page.
A single service account with a stale password can generate thousands of failures that read as an attack.
Parsing these codes into fields (as im_msvistalog does) lets you separate the misconfigured scheduled task from the actual password spray in one query.
A service that keeps restarting
Correlate three views on one timeline: Service Control Manager events (7031/7034) tell you when the service died, the application’s own log tells you what it was doing, and system-level logs tell you about the environment.
For example, the Linux kernel logs out-of-memory killer activity to kern.log and the journal right before it terminates the largest process.
When all three sources share one timestamped store, the sequence usually explains itself.
If the misbehaving component is the collection agent itself, the NXLog Agent troubleshooting section covers its internal logs and common errors.
Gaps in the timeline
If events from two servers disagree about the order of things, check clocks before anything else.
The ACSC/CISA joint guidance recommends consistent ISO 8601 timestamps with millisecond precision (for example, 2024-07-25T20:54:59.649Z) precisely because mixed formats and time zones wreck cross-system correlation.
Standardize on UTC in the pipeline, keep NTP healthy on every server, and confirm your agents buffer during outages.
With disk-backed buffering via the Buffer processor module, a network blip delays events instead of deleting them.
Common challenges in server log analysis
- Volume and cost
-
Servers produce far more log data than any team can afford to index raw. The answer is processing at the source: deduplicate, filter, and normalize on the endpoint so that what crosses the network is signal. This is a core design goal of NXLog Agent.
- Format sprawl
-
Windows XML events, BSD syslog, RFC 5424 syslog, W3C files, JSON, and free-text application logs all describe similar facts differently. Normalize once, at collection time, into a consistent schema — every downstream query, dashboard, and detection gets simpler.
- Tampering and loss
-
Logs stored only on the originating server are one
wevtutil clorrmaway from gone. That is exactly why ATT&CK tracks indicator removal. Ship events off-host within seconds over TLS (TLS/SSL output module), buffer during outages, and if your compliance regime demands it, add integrity verification with the HMAC Message Integrity processor module. - Retention versus privacy
-
Retention obligations (like the 12 months required by PCI DSS Requirement 10.5.1) collide with data-minimization duties when logs contain personal data or secrets. The OWASP Logging Cheat Sheet lists what should never be logged in the first place; for what remains, the Rewrite extension module can rename, delete, or keep only the fields you list before events leave the server.
Server log analysis best practices
- Write the logging policy first
-
Which sources, which events, what retention, who reviews — agreed and documented before tooling. This is the opening recommendation of the ACSC/CISA joint guidance.
- Standardize timestamps
-
ISO 8601, millisecond precision, UTC everywhere, NTP on every host — per the same guidance.
- Centralize quickly, transport securely
-
Near-real-time forwarding over TLS to storage that server administrators can’t modify. NIST SP 800-92 treats protecting logs from unauthorized access and modification as a core log management requirement.
- Retain to your strictest obligation
-
For cardholder environments that means at least 12 months with three months immediately searchable (PCI DSS v4.0.1, Requirement 10.5.1); CIS Control 8 provides a solid baseline where no regulation applies.
- Filter with intent
-
Every drop rule is a documented risk decision, reviewed when your threat model changes — not a silent cost optimization.
- Monitor the pipeline itself
-
A dead agent looks exactly like a quiet server. NXLog Agent’s Internal input module surfaces the agent’s own errors, and Mark input module emits periodic heartbeat messages so silence becomes detectable.
- Review and tune on a schedule
-
NIST SP 800-92 emphasizes regular review; detections rot as infrastructure changes, so treat your event list and alert rules as living documents.
How NXLog Platform supports server log analysis
Everything in this guide runs on two components, plus a free entry point.
NXLog Agent is the collection layer: a single lightweight agent with 120+ built-in modules that collects, transforms, and routes telemetry across more than 40 operating system and architecture combinations — Windows, Linux, macOS, BSD, AIX, and Solaris, including legacy systems that other agents no longer support.
It processes data on the source (filtering, deduplication, enrichment, format conversion), forwards resiliently with buffering and save-to-disk when receivers are unreachable, and ships natively to destinations like Splunk, Microsoft Sentinel, Google SecOps, Elasticsearch, IBM QRadar, and Apache Kafka. If you’re running NXLog Enterprise Edition today, NXLog Agent is its direct successor — the same collection engine, redesigned as the agent layer of NXLog Platform.
NXLog Platform adds what a fleet of agents needs: centralized agent enrollment and configuration management, built-in storage, and search and analytics on top of the collected data. The NXLog Platform documentation and release notes cover current capabilities in detail, and you can start free with up to 10 sources to test the full pipeline from this guide.
Conclusion
Server logs are the closest thing you have to a flight recorder for your infrastructure. Analyzed well, they shorten breach detection, satisfy auditors, and turn 3 a.m. outages into readable timelines. The key points to take away:
-
Know your sources. Windows Event Log channels, Linux flat files and the journal, and web/database logs each hold different pieces of the story — collect them all.
-
Centralize fast and securely. Events should leave each server within seconds, over TLS, to storage attackers can’t reach. Techniques for erasing local logs are standard attacker tradecraft.
-
Parse and normalize at the source. Structured, consistent records make every downstream detection and investigation simpler, and they cut what you pay to ingest.
-
Alert on the short list. Failed-logon bursts, cleared audit logs, new services and scheduled tasks, and privilege changes catch a large share of real attacker behavior.
-
Keep tuning. Policies, drop rules, and detections need scheduled review, and the pipeline itself needs monitoring.
Start with the configuration examples above, adapt them to your environment, and build from there. And if you’d like help designing your collection architecture, we’re happy to talk it through.
FAQ
- What is server log analysis?
-
Server log analysis is the practice of collecting, parsing, and examining the event records servers produce — authentication events, service activity, application and web server output — to detect security threats, meet compliance requirements, and troubleshoot operational problems. It combines automated real-time monitoring with manual investigation across centralized log data.
- How do you analyze server logs?
-
Define a logging policy, collect events from every in-scope server with an agent such as NXLog Agent, centralize them over TLS, and parse them into structured, normalized records. Then monitor for high-value signals: failed-logon bursts, cleared audit logs, new services; and investigate by correlating events across systems on a single timeline.
- Where are server logs stored?
-
Windows stores event logs as
.evtxfiles under%SystemRoot%\System32\winevt\Logs\, viewable in Event Viewer. Linux writes flat files under/var/log/— such asauth.logorsecurefor authentication — alongside the systemd journal, read withjournalctl. Web and database servers keep their own logs, like Apache’saccess.logor IIS files under\inetpub\logs\LogFiles. - How long should you keep server logs?
-
Long enough to satisfy your strictest applicable obligation. PCI DSS v4.0.1 Requirement 10.5.1, for example, requires at least 12 months of audit log history with the most recent three months immediately available for analysis. Where no regulation applies, base retention on your incident response needs. Breaches commonly go undetected for months, and short retention windows can leave investigations blind.
- What is the difference between log monitoring and log analysis?
-
Log monitoring is the continuous, automated part: watching incoming events and alerting when defined conditions occur, such as repeated failed logons. Log analysis is the broader discipline that includes monitoring plus investigation — querying, correlating, and reconstructing activity across systems, often after the fact. Effective server log analysis needs both.