
Fluent Bit wins on footprint. Logstash wins on parsing depth. The choice isn’t which tool is "better" — it’s where in your pipeline each one earns its keep, and what your detection tier silently misses when you put one in the wrong tier.
Pick wrong and the cost shows up in three places: detection latency when batches stall, audit evidence when collectors stop shipping, and MTTR when responders can’t tell whether a quiet endpoint is an attack indicator or a broken agent. This comparison covers what actually changes between the two tools at the level a SecOps engineer cares about: resource budgets, parsing flexibility, reliability guarantees, and the operational shape of running them in production.
At a glance
| Dimension | Fluent Bit | Logstash |
|---|---|---|
Runtime |
C, native binary |
JVM (default heap 1 GB; tunable via |
Baseline memory |
Single-digit MB per agent (per official docs) |
~1 GB JVM heap default before tuning |
Config format |
YAML or classic INI |
Pipeline DSL (Ruby-flavored) |
Custom logic |
Lua scripts, WASM filters |
Ruby filter plugin, plus DSL primitives |
Parsing flexibility |
Built-in parsers for JSON, syslog, regex, ltsv |
Grok, dissect, mutate, kv, plus 50+ filter plugins |
Reliability buffer |
Filesystem buffering, per-output backpressure, DLQ at chunk level (v4.2+) |
Persistent queues, DLQ at event level |
Source coverage strength |
Kubernetes, container runtimes, systemd, cloud APIs, OpenTelemetry |
Beats ecosystem, JDBC, JMS, broad vendor protocol plugin set |
Windows Event Log depth |
Limited (no native event channel subscription) |
Limited (no native event channel subscription) |
SIEM output coverage |
Elastic, Splunk HEC, Microsoft Sentinel (DCR-based, GA), Google SecOps, Kafka, S3, Loki, OpenTelemetry |
Same set, plus first-class Elastic; Microsoft Sentinel DCR plugin in public preview |
License |
Apache 2.0 |
Apache 2.0 (unchanged through Elastic’s 2021 and 2024 license shifts) |
One clarification on that last row, since it confuses people. Only Elasticsearch and Kibana moved to SSPL/ELv2 in 2021, and Elastic added AGPLv3 alongside in 2024. Elastic’s own FAQ is clear on this: "our language clients and Logstash have always been available under the Apache 2.0 license." If anyone tells you Logstash isn’t open source anymore, they’re wrong.
Architecture and deployment
The two tools were built for different jobs, and the design choices show up faster than you’d think when you push either one into a role it wasn’t built for.
Fluent Bit is written in C and ships as a CNCF graduated project under the Fluentd umbrella (Fluentd graduated April 11, 2019; Fluent Bit graduated alongside it as a sub-project). The current stable line is v4.x, with v4.2 adding the Dead Letter Queue feature and routing improvements. Design priorities are low memory, fast startup, and easy embedding — as a Kubernetes DaemonSet, an OpenTelemetry collector sidecar, or a lightweight agent on a constrained host. The official documentation is the primary source for configuration syntax and plugin reference.
Logstash runs on the JVM and ships as part of the Elastic Stack. The source repository and official docs describe a server-side process that receives shipped logs — often from Beats or other agents — applies heavy transformation through its pipeline DSL, and writes to one or more destinations. The plugin ecosystem is large; the resource budget reflects that.
Here’s where each tool typically sits in a SecOps pipeline:
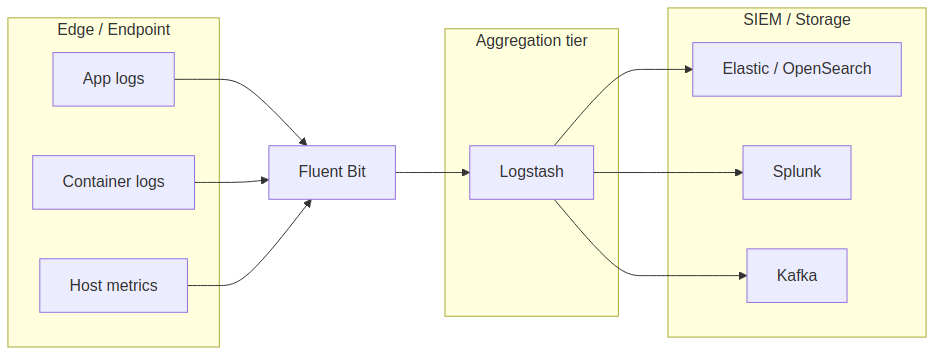
This is the Beats-style pattern with Fluent Bit playing the lightweight shipper role and Logstash doing aggregation and transformation. You can run Fluent Bit end-to-end. You can run Logstash on endpoints. Neither tool is locked to a tier — but if you put Logstash on hundreds of low-spec endpoints, the JVM footprint will hurt; if you push deep vendor-specific parsing into Fluent Bit, you’ll write more glue code than you expected.
Fluent Bit vs Logstash on measurable dimensions
Resource footprint
The numbers that exist come from official documentation rather than head-to-head benchmarks.
Fluent Bit’s own comparison page cites a memory footprint of roughly 650 KB at idle for Fluent Bit, compared to "tens of MB" for Fluentd.
Logstash, running on the JVM, ships with a default heap of 1 GB, configurable in jvm.options (Elastic docs).
Real-world usage depends on plugin count, pipeline complexity, and event rate, but the order-of-magnitude gap is what it looks like.
For a centralized aggregation tier on dedicated infrastructure, the JVM overhead is fine. On endpoints — Kubernetes DaemonSets across hundreds of nodes, or workstations where the security team can’t be the loudest tenant on the box — it isn’t.
Be careful with public benchmark numbers from vendor blog posts. They’re useful as orders of magnitude, but most of them measure throughput against tuned configurations on hardware you don’t have. Run your own test with your actual log volumes, your actual parsers, and the destinations you actually use.
Configuration complexity
The two configuration models look like this. Fluent Bit, classic INI form:
[SERVICE]
    Flush        5
    Daemon       Off
    Log_Level    info

[INPUT]
    Name         tail
    Path         /var/log/auth.log
    Parser       syslog-rfc5424
    Tag          auth

[FILTER]
    Name         modify
    Match        auth
    Add          env production

[OUTPUT]
    Name         es
    Match        *
    Host         elastic.internal
    Port         9200
    Index        secops-auth
    tls          On
    tls.verify   On
Logstash, pipeline DSL:
input {
  file {
    path           => "/var/log/auth.log"
    type           => "auth"
    start_position => "beginning"
  }
}

filter {
  if [type] == "auth" {
    grok   { match => { "message" => "%{SYSLOGLINE}" } }
    mutate { add_field => { "env" => "production" } }
  }
}

output {
  elasticsearch {
    hosts       => ["https://elastic.internal:9200"]
    index       => "secops-auth-%{+YYYY.MM.dd}"
    ssl_enabled => true
  }
}
Both are readable. The difference shows up at scale, when a single pipeline has dozens of branches and you’re choosing between many INI sections joined by tags versus one DSL block with conditional logic. Logstash’s DSL handles branching more cleanly. Fluent Bit’s tagging is faster to scan when each section does one thing. Reasonable teams disagree, and the choice often follows whoever’s on call at 3 a.m.
Features and capabilities
Parsing and transformation
Logstash leads here, and it’s not close for messy vendor logs. Grok patterns handle the irregular reality of firewall, proxy, and custom application output without forcing you to write a parser per format:
filter {
  grok {
    match => { "message" => "%{IPORHOST:src_ip} %{WORD:action} %{GREEDYDATA:details}" }
  }
  mutate {
    add_field => { "pipeline_stage" => "enriched" }
  }
  geoip {
    source => "src_ip"
    target => "geo"
  }
}
Fluent Bit handles the well-known formats — JSON, syslog RFC 3164/5424, ltsv, regex — and gives you Lua or WASM for the rest:
[FILTER]
    Name      parser
    Match     auth.*
    Key_Name  log
    Parser    syslog-rfc5424

[FILTER]
    Name      lua
    Match     *
    script    enrich.lua
    call      add_geo
The Lua path works, and it’s fast, but you’re writing more code per new format than you would with Grok. If your environment is dominated by structured JSON or well-known shapes, Fluent Bit’s built-in parsers are enough. If you’re constantly onboarding new vendor formats, Logstash saves real engineering time.
Neither tool offers a paid tier that unlocks more parsers. Both ship everything in their open-source builds.
Reliability and delivery guarantees
Logstash’s persistent queue is the more mature mechanism. It writes events to disk before acknowledgment, survives restarts cleanly, and supports a dead letter queue (DLQ) at the event level — a single bad record doesn’t take its neighbors with it. The behavior and failure modes are well documented and well understood at scale.
Fluent Bit added a DLQ in v4.2 (November 2025, via the storage.keep.rejected parameter — see the official troubleshooting guide).
It works, but it preserves failed chunks rather than individual events.
A single bad record can park the chunk it shipped with.
Fluent Bit also has filesystem buffering and per-output backpressure (storage.type filesystem, storage.total_limit_size), which cover most operational cases — but the granularity of recovery isn’t equivalent to Logstash’s.
For SecOps, the granularity matters most at the egress hop. Losing events between an EDR agent and your SIEM is one of the worst outcomes you can quietly cause, and "lost the whole batch that contained one bad event" reads differently in a post-incident review than "lost one event."
Source coverage and the Windows gap
Fluent Bit’s strengths are Kubernetes, container runtimes, systemd, and cloud provider APIs. Logstash’s input plugin set is broader on the vendor protocol side: Beats, JDBC, JMS, SNMP, and the long tail.
The gap worth calling out for SecOps: neither tool handles Windows Event Log collection the way a Windows-native agent does. Both can read forwarded events. Both can parse XML or JSON exports. Neither subscribes to Windows Event channels with the depth that compliance frameworks and detection teams want — ETW providers, DNS analytical logs, Sysmon at high volume, forwarded events from large estates. This is where specialized Windows-native agents (NXLog Agent is the one we know best) fit, and it’s part of why a Windows-heavy estate often isn’t a clean Fluent Bit vs Logstash decision.
Output and SIEM destinations
Both tools cover the destinations a SecOps team needs: Splunk HEC, Elastic, OpenSearch, Microsoft Sentinel, Google SecOps via HTTPS push, Kafka for fan-out, and S3 for archive.
One thing to factor in if you’re targeting Sentinel: the legacy Azure HTTP Data Collector API retires September 14, 2026, so any pipeline you stand up this year needs to target the DCR-based Logs Ingestion API.
Fluent Bit ships an azure_logs_ingestion output plugin built on the new API.
Microsoft’s DCR-based Logstash output plugin is still in public preview as of mid-2026 — usable, and Microsoft rebuilt it in Java in early 2026 for better security and support — but if you’re standing up production Sentinel ingestion this year, factor that maturity gap into the decision.
Logstash leans toward Elastic destinations because that’s its origin story. Fluent Bit’s outputs to Loki and OpenTelemetry collectors are first-class, which fits its CNCF lineage.
Extensibility and fleet operability
Both tools are extensible through code — Lua/WASM for Fluent Bit, Ruby filters for Logstash — and both have active plugin ecosystems. Neither one ships with a built-in management plane.
That last point matters more than it sounds. After you’ve chosen a collector, the next problem shows up fast: how do you run hundreds or thousands of them? Centralized config distribution, version and policy control, visibility into collector health, audit trails for PCI DSS, HIPAA, ISO 27001, or NIS2 evidence — Fluent Bit and Logstash both leave these to you. You can build them with Ansible, a Git-driven config repo, and Prometheus dashboards, and many teams do. At small scale it’s fine. At enterprise scale, the operational cost adds up, and it’s the kind of cost that doesn’t show in a benchmark.
If you reach that scale and don’t want to build it yourself, NXLog Platform is a management plane built for fleets of telemetry agents — config templates, policy enforcement, health visibility, and audit history across mixed-OS estates. It’s a different layer of the problem and worth knowing about before you’ve sunk six months into homegrown agent management.
Use-case scenarios
- Mid-size cloud-native SaaS team, 300 GB/day, mostly Kubernetes, 2 SREs
-
Fluent Bit end-to-end. Run it as a DaemonSet on each node, ship directly to your SIEM or to an OpenTelemetry collector. The footprint is right for hundreds of pods, the Kubernetes integration is mature, and you don’t need Grok for the JSON-structured app logs that dominate this kind of estate. Logstash is overkill at this volume and adds a JVM to operate.
- Enterprise SecOps, 5 TB/day, heterogeneous Windows + Linux + cloud, dedicated SOC
-
Neither tool on its own. Use Fluent Bit on Linux and Kubernetes nodes for the cloud-native side. Use Logstash (or a similar aggregator) in the middle if you need Grok for vendor formats. For Windows Event Log depth across thousands of hosts — ETW, DNS analytical, Sysmon — pair with a specialized Windows agent. Fleet management becomes the dominant operational cost at this scale, not the collector choice itself.
- Small DevOps team running ELK, 50 GB/day, single data center
-
Logstash. You’re already paying the JVM cost on the aggregator and the team knows Grok. Adding Fluent Bit on the edge buys you marginal footprint savings at the cost of two configuration models to maintain. Pick one and keep it simple.
- Platform team standardizing on OpenTelemetry, 1 TB/day across multi-cloud
-
Fluent Bit. OTLP ingestion and delivery are first-class in Fluent Bit v3+, and the CNCF alignment means fewer impedance mismatches with the rest of your observability stack. Logstash has OpenTelemetry support but it’s not the path of least resistance.
- Compliance-heavy regulated environment, 800 GB/day, audit trails required
-
Either tool works for the data plane, but neither answers the audit-trail-on-collector-config question. If you’re being asked to produce evidence of who changed what on which collector and when, plan to build that layer yourself or buy it — and budget for the work either way. The collector choice is the easy half of the problem.
Conclusion
If you’re cloud-native and OpenTelemetry-aligned, pick Fluent Bit. The footprint, the Kubernetes story, the CNCF lineage, and the OTLP support compound. Logstash will work, but you’re paying for capability you don’t need.
If you’re inside the Elastic Stack and your team knows Grok, pick Logstash. The persistent queue is more mature, the parsing library saves real engineering time on messy vendor logs, and the JVM cost is acceptable on a centralized aggregator. Don’t replatform just to chase a smaller footprint at the aggregation tier.
If your estate is mixed — Windows Event Logs, Linux syslog, cloud audit, OT/IoT, legacy appliances at thousands of hosts — neither tool answers the full problem on its own. Use Fluent Bit on the cloud-native edge. Use Logstash or a similar aggregator in the middle if Grok is paying for itself. Plan for a specialized Windows agent on the Windows side. And budget for fleet management as a separate workstream from the day you pass a few hundred hosts, whether you build it or buy it.
The public throughput numbers floating around vendor blogs are useful as orders of magnitude and not much more. Test both tools with your actual log volumes, your actual parsers, and the destinations you actually use. The goal is a pipeline you can reason about under pressure — not one that wins a feature comparison on paper.