Your firewalls already record allowed and denied connections and policy changes. Each vendor logs them in its own format. This post shows you how to get those records into one searchable structure, with working configurations for the most common sources.
A firewall log analyzer is a tool that collects logs from firewalls, parses each vendor’s log format into structured fields, and stores the results in one place for searching, alerting, and reporting. It turns raw records of allowed connections, denied connections, threat detections, and configuration changes into data you can investigate.
Palo Alto, Fortinet, Cisco, Check Point, pfSense, and Windows each format their logs differently, down to the names they give the same field. The sections below cover what firewall logs contain, compare the main analyzer options, and map the architectures that move logs reliably from source to SIEM, including ready-to-use NXLog Agent configurations for the most common firewalls.
What is a firewall log analyzer?
A firewall log analyzer does four jobs:
- Collection
-
It receives or pulls logs from firewalls, usually over syslog, and from firewall software running on hosts.
- Parsing and normalization
-
It converts each vendor’s format into structured fields, so
srcipon a FortiGate and the Source IP column in a PAN-OS log end up queryable the same way. - Storage and retention
-
It keeps logs searchable for as long as your investigations and auditors need them.
- Analysis and reporting
-
It supports searches, dashboards, alerts, and the reports you hand to an assessor.
Tools that do these jobs fall into three groups. Vendor-native analyzers, such as FortiAnalyzer, Panorama, and Check Point SmartEvent, go deep on their own vendor’s devices. Dedicated multi-vendor analyzers, such as ManageEngine Firewall Analyzer, focus on firewall reporting across brands. The third group pairs a vendor-neutral collection layer with a SIEM or analytics platform, which is the pattern this article focuses on because it survives firewall vendor changes.
What firewall logs contain: types and formats by vendor
Most firewalls separate their output into a few log types. Traffic or session logs record every connection the device allowed or denied. Threat logs record IPS, antivirus, and URL-filtering verdicts. System and audit logs record administrator logins and policy changes. Forwarding profiles often leave them out. PAN-OS, for example, generates traffic, threat, config, system, and HIP match logs as separate types, each with its own field list.
The formats those types arrive in vary widely:
| Firewall | How logs leave the device | Payload format | Format reference |
|---|---|---|---|
Palo Alto PAN-OS |
Syslog server profile |
Comma-separated values with positional fields and FUTURE_USE placeholders |
|
Fortinet FortiGate |
Syslog or FortiAnalyzer |
key=value pairs, quoted where values contain spaces |
|
Cisco ASA |
Syslog over UDP, TCP, or TLS |
Text messages keyed by |
|
Check Point |
Log Exporter |
Syslog, CEF, LEEF, or JSON |
|
pfSense |
Remote syslog |
|
|
Windows Defender Firewall |
Windows Event Log, plus optional |
Event Log records; W3C-style text |
This format sprawl is the engineering problem a firewall log analyzer solves.
A deny on one platform is a block on another and an action="close" on a third.
Until you parse those records into a common structure, you can’t search or correlate across vendors.
Why centralize firewall logs?
Reading logs on each firewall’s own console works for one or two devices. Beyond that, centralization pays for itself quickly:
- Correlation
-
A port scan that probes your branch ASA and your HQ FortiGate leaves a few scattered denies in each console. Pull both into one store and the same source address shows up walking across your network.
- Retention and compliance
-
PCI DSS v4.0.1 Requirement 10.5.1 requires you to retain audit log history for at least 12 months, with the most recent three months immediately available for analysis, and Requirement 10.4.1 requires daily log reviews. Firewall storage rarely holds a year of logs.
- A single query surface
-
Analysts investigate faster when one search language covers every device, instead of one console per vendor.
- Cost control
-
Firewalls are among the loudest log sources in any network. Filtering and deduplicating before logs reach a per-GB-billed SIEM keeps the bill tied to signal rather than volume.
Government guidance points in the same direction. NIST SP 800-92 describes centralized log management as the basis of a workable logging program. The 2024 joint publication Best Practices for Event Logging and Threat Detection from ASD’s ACSC, CISA, the FBI, and the NSA recommends centralizing logs in structured formats such as JSON and protecting their integrity in transit and at rest. For a closer look at the payment-card requirements, see our guide to PCI DSS logging compliance.
Firewall log analyzer tools compared
The right tool depends on how mixed your estate is and where analysis should happen. Here is how the main options line up:
| Tool | Firewall coverage | Deployment | Collection | Analysis and reporting | Best fit when |
|---|---|---|---|---|---|
Any syslog-capable firewall, plus host and OT sources, through 120+ modules |
On-premises |
Agent-based and agentless relay: syslog, NetFlow, files, APIs |
Search, dashboards, and alerting in the platform; parsed logs route to any SIEM |
You run a mixed estate and want one collection layer that outlives vendor and SIEM changes |
|
Multi-vendor firewalls and proxies |
On-premises |
Agentless syslog |
Prebuilt firewall traffic, policy, and compliance reports |
You mainly need turnkey firewall reports |
|
Fortinet Security Fabric |
Appliance, VM, or cloud |
Native FortiOS logging |
Fortinet-specific analytics and SOC views |
Your estate is all Fortinet |
|
Panorama + Strata Logging Service |
Palo Alto NGFW |
Appliance or VM, plus cloud service |
Native PAN-OS log forwarding |
Palo Alto management and log analytics |
Your estate is all Palo Alto |
Any, via add-ons |
Cloud or on-premises |
Forwarders, syslog, HTTP Event Collector |
Search language, dashboards, correlation |
Splunk is already your SIEM |
|
Any, via connectors and agents |
Cloud (Azure) |
Azure Monitor Agent, CEF/syslog forwarders |
KQL analytics, automation, detections |
You are committed to Azure and per-GB ingest pricing fits your volume |
|
Any syslog source |
Self-managed or cloud |
Syslog and agent inputs |
Streams, alerts, dashboards |
You want an open core with commercial options |
|
Any, via Elastic Agent and integrations |
Self-managed or Elastic Cloud |
Elastic Agent, Beats, syslog |
Detections and search on the Elastic Stack |
You want search-centric analytics you operate yourself |
No single row wins every column. FortiAnalyzer and Panorama see deeper into their own vendor’s devices than any third-party tool does. ManageEngine ships canned firewall reports that a general-purpose pipeline does not replicate out of the box. A SIEM remains the natural home for cross-source correlation and case management.
The argument for a vendor-neutral layer is architectural. Firewalls get replaced, and SIEMs get replaced more often than most teams expect. When collection, parsing, and filtering live in a layer you control, a vendor swap means changing one input or output configuration instead of rebuilding the pipeline. NXLog Platform takes that position: NXLog Agent collects and parses at the edge, the platform stores and analyzes what you keep on-premises, and it forwards anything your SIEM needs, already structured.
Reference architectures: from firewall to SIEM
The most common starting point is direct forwarding: every firewall sends syslog straight to the SIEM, usually over UDP. This layout fails in three ways. Events have nowhere to queue during SIEM maintenance, nothing filters the volume before the per-GB meter, and UDP gives no delivery guarantee on busy links.
A relay tier fixes all three at once. Figure 1 shows the reference layout.
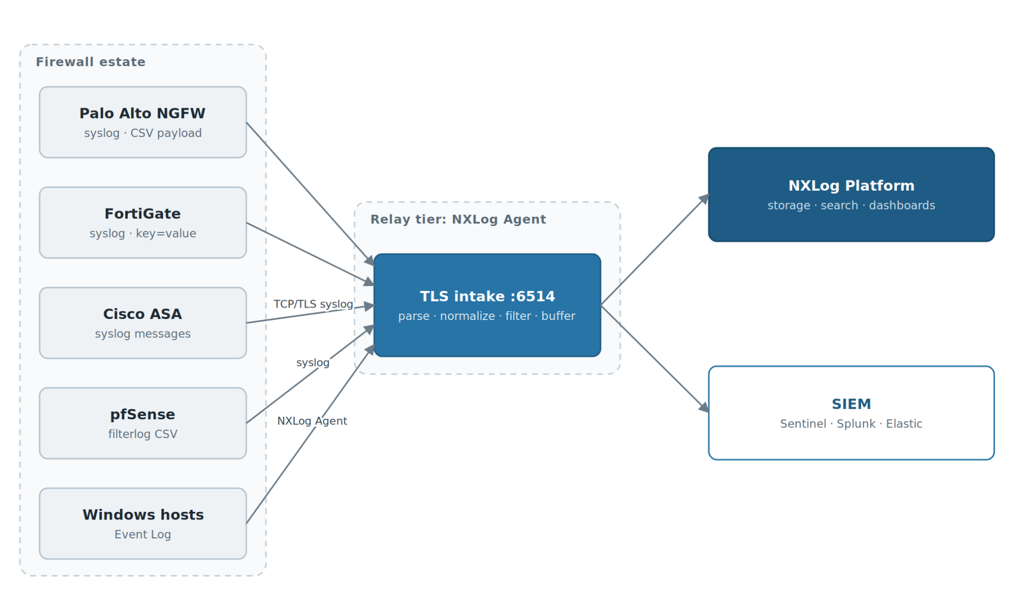
Three design choices in this layout matter more than the boxes:
- Transport
-
Prefer TCP, and TLS where the device supports it. Cisco’s own behavior illustrates why transport is not an afterthought: an ASA logging over TCP blocks all new connections when its syslog server goes down unless
logging permit-hostdownis set, a detail covered in NXLog’s Cisco ASA guide. - Processing location
-
Parsing and filtering happen at the relay, before the WAN and before the SIEM meter. The relay forwards structured events, not raw strings.
- Buffering
-
The relay persists events to disk when a destination is unreachable, then forwards the backlog when it returns. A SIEM maintenance window no longer costs you data.
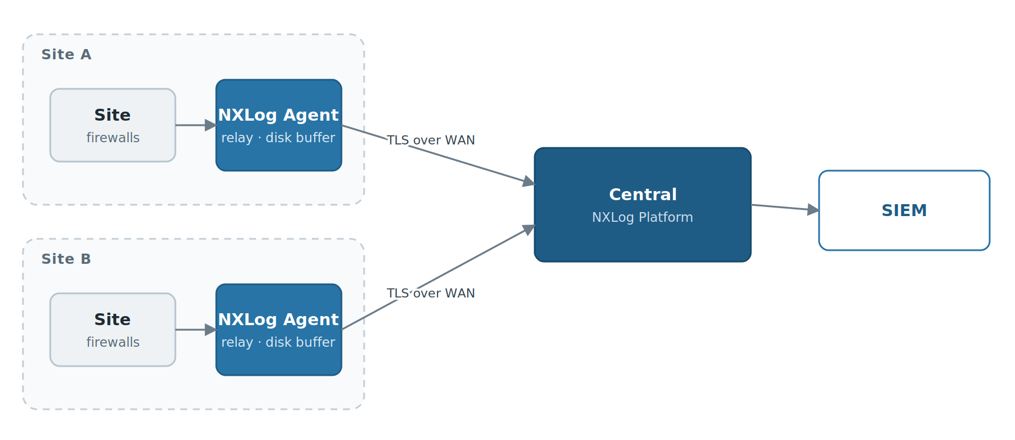
Multi-site estates repeat the pattern per location, as in Figure 2. Each site’s relay buffers locally through WAN outages and forwards when the link returns.
Configuration packs: collecting logs from major firewalls
The packs below are working NXLog Agent configurations for the most common sources. Each extends the same baseline, so you can run them side by side on one relay and route them together.
Pack 1: Baseline syslog intake over TLS
Port 6514 is the IANA-assigned port for syslog over TLS.
The TLS/SSL input module terminates the encrypted connection, and the Syslog extension parses the header into fields such as $Hostname, $SyslogSeverity, and $EventTime.
<Extension syslog>
    Module         xm_syslog
</Extension>

<Input firewall_tls>
    Module         im_ssl
    ListenAddr     0.0.0.0:6514
    CAFile         /opt/nxlog/cert/ca.pem
    CertFile       /opt/nxlog/cert/agent-cert.pem
    CertKeyFile    /opt/nxlog/cert/agent-key.pem
    Exec           parse_syslog();
</Input>
For devices that cannot do TLS, use the TCP input module on a separate port and keep UDP as a last resort only.
Pack 2: Cisco ASA
ASA messages carry their meaning in the %ASA-severity-messageID prefix.
This configuration, adapted from NXLog’s Cisco ASA integration guide, extracts the severity and message ID so you can filter and alert on them directly.
Message IDs are documented in the Cisco ASA Series Syslog Messages book.
<Extension syslog>
    Module        xm_syslog
</Extension>

<Input cisco_asa>
    Module        im_tcp
    ListenAddr    0.0.0.0:1514
    <Exec>
        parse_syslog();
        if ($Message =~ /^%(ASA)-(\d)-(\d{6}): (.*)$/) {
            $ASASeverityNumber = $2;
            $ASAMessageID = $3;
            $ASAMessage = $4;
        }
    </Exec>
</Input>
The same guide also shows how to receive NetFlow from ASA with the NetFlow extension if you want per-flow records alongside syslog.
Pack 3: Palo Alto PAN-OS
PAN-OS formats every log type as a comma-separated value string with positional fields, so the Delimiter-Separated Values extension is the right parser. The Traffic log has more than 50 positional fields; the configuration below names the first 16 for readability, and you should list the full set, in order, from Palo Alto’s Traffic log field reference.
<Extension syslog>
    Module        xm_syslog
</Extension>

<Extension pan_traffic_csv>
    Module        xm_csv
    Fields        FutureUse1, ReceiveTime, SerialNumber, Type, ThreatContentType, FutureUse2, \
                  GeneratedTime, SourceIP, DestinationIP, NATSourceIP, NATDestinationIP, RuleName, \
                  SourceUser, DestinationUser, Application, VirtualSystem
</Extension>

<Input pan>
    Module        im_tcp
    ListenAddr    0.0.0.0:1515
    <Exec>
        parse_syslog();
        pan_traffic_csv->parse_csv($Message);
    </Exec>
</Input>
Fields containing commas arrive double-quoted, which the parser’s default quote handling accepts.
If you forward multiple PAN-OS log types to the same port, branch on the Type field and apply a per-type field list, because each type has its own field order.
Pack 4: Fortinet FortiGate
FortiGate logs arrive as key=value pairs, with quoted values where spaces occur, as documented in the FortiOS Log Message Reference.
The Key-Value Pairs extension turns each pair into a field with no positional mapping required, so fields such as srcip, dstip, policyid, and action come out ready to query.
<Extension syslog>
    Module         xm_syslog
</Extension>

<Extension fortigate_kvp>
    Module         xm_kvp
    KVPDelimiter    ' '
    KVDelimiter     =
    KeyQuoteChar    '"'
</Extension>

<Input fortigate>
    Module          im_tcp
    ListenAddr      0.0.0.0:1516
    <Exec>
        parse_syslog();
        fortigate_kvp->parse_kvp($Message);
    </Exec>
</Input>
Pack 5: Windows Defender Firewall
Windows hosts log firewall activity to a dedicated Event Log channel, which a local NXLog Agent reads with the Event Log for Windows input module. You can also audit blocked and allowed connections into the Security log as Filtering Platform events. NXLog’s Windows Firewall guide walks through the audit policy setup and both collection paths.
<Input windows_firewall>
    Module    im_msvistalog
    <QueryXML>
        <QueryList>
            <Query Id="0">
                <Select Path="Microsoft-Windows-Windows Firewall With Advanced Security/Firewall">*</Select>
            </Query>
        </QueryList>
    </QueryXML>
</Input>
Pack 6: Routing parsed logs to your SIEM
Once every source is parsed, output becomes one block per destination. Serializing to JSON keeps the structure intact and matches the structured-format recommendation in the joint event-logging guidance. NXLog publishes destination-specific walkthroughs for Microsoft Sentinel, Splunk, and other SIEMs; Check Point sources have a dedicated guide as well.
<Extension json>
    Module    xm_json
</Extension>

<Output siem>
    Module    om_tcp
    Host      siem.example.com:10514
    Exec      to_json();
</Output>

<Route firewalls_to_siem>
    Path      firewall_tls, cisco_asa, pan, fortigate, windows_firewall => siem
</Route>Analyzing firewall logs: what to detect
Centralized, parsed firewall logs support a set of detections that raw syslog cannot:
- Scanning and discovery
-
Many denies from one source across sequential ports or hosts map to network service discovery (T1046). Each firewall records only the probes aimed at it, so the pattern becomes visible once denies from every device land in one store.
- Beaconing in allowed traffic
-
Outbound connections at fixed intervals to the same destination are a classic sign of command and control over application layer protocols (T1071). These hide in permitted traffic, which is why collecting only denies leaves a blind spot.
- Unusual egress volume
-
Large or off-hours outbound transfers, especially over protocols that rarely carry bulk data, are worth correlating against exfiltration over alternative protocol (T1048).
- Policy and configuration changes
-
PAN-OS config logs, FortiGate event logs, and ASA command-audit messages record who changed what. A rule change outside a change window deserves an alert as much as any traffic pattern.
Volume is the practical obstacle, and it is solvable at the relay. The filter below drops routine informational allow records before they reach storage or the SIEM, while keeping every deny and everything at notice level or above:
<Extension syslog>
    Module        xm_syslog
</Extension>

<Input firewall_tls>
    Module        im_ssl
    ListenAddr    0.0.0.0:6514
    CAFile        /opt/nxlog/cert/ca.pem
    CertFile      /opt/nxlog/cert/agent-cert.pem
    CertKeyFile   /opt/nxlog/cert/agent-key.pem
    <Exec>
        parse_syslog();
        if ($SyslogSeverityValue >= 6 and $Message =~ /action="?(accept|allow|permit)/) {
            drop();
        }
    </Exec>
</Input>
Adjust the action pattern to your vendors' field names, and confirm your compliance scope before dropping anything. For systems in a cardholder data environment, retention obligations can extend to allowed-connection records too.
Best practices for firewall log management
- Prefer TCP or TLS over UDP
-
UDP syslog offers no delivery guarantee, and busy firewalls are exactly where datagrams get dropped. Reserve UDP for devices that support nothing else, and terminate it as close to the source as possible.
- Normalize timestamps at collection
-
Convert event times to UTC in a consistent format when logs enter the pipeline — the joint event-logging guidance specifically recommends ISO 8601 with the year first. Our guide to normalizing log timestamps to ISO 8601 covers doing this at collection. PCI DSS Requirement 10.6 requires synchronized clocks because correlation across devices fails when timestamps disagree.
- Collect audit logs, not just traffic
-
Policy changes, administrator logins, and failed console authentications are low-volume and high-signal. Make sure your forwarding profiles include the config and system log types.
- Tier your retention
-
Keep recent months hot and searchable, and archive the rest cheaply. PCI DSS 10.5.1 sets a floor of 12 months with three immediately available; your incident-response history may argue for more.
- Filter at the edge, not at the destination
-
Every event you drop at the relay is bandwidth, storage, and SIEM ingest you never pay for. Filtering downstream saves none of those.
- Monitor the pipeline itself
-
A forwarder that dies silently is a visibility outage that looks like a quiet network. Alert when a source goes quiet and when relay buffers start filling, and verify log integrity in transit and at rest as the joint event-logging guidance recommends.
How NXLog Agent helps you collect, filter, and forward firewall logs
NXLog Agent is the collection layer that the architectures and packs above are built on. For firewall log analysis specifically, the relevant capabilities are:
- Relay collection for network devices
-
It receives syslog, NetFlow, and other network telemetry from devices where no agent can be installed, alongside agent-based collection on Windows and Linux hosts.
- Parsers for every major format
-
Syslog, CSV, key=value, CEF, LEEF, JSON, and W3C parsing ship as modules, so PAN-OS, FortiGate, ASA, Check Point, and pfSense records all normalize into the same structure.
- Processing at the source
-
Filtering, deduplication, and enrichment run at the agent or relay, before data crosses the WAN or reaches a metered SIEM.
- Secure, resilient transport
-
TLS on both intake and forwarding, with configurable disk buffering when a destination is unreachable.
- Coverage where other agents stop
-
It runs on more than 40 operating system and architecture combinations, including legacy Windows and OT-adjacent systems that modern agents no longer support.
NXLog Platform adds fleet management for those agents, on-premises log storage, and search and dashboards on top, and it forwards whatever subset your SIEM should see. You can test it free for up to 10 sources.
Conclusion
Firewall logs record the traffic your network edge allowed, what it blocked, and who changed its rules.
Using them across vendors is an architecture problem: PAN-OS sends positional CSV, FortiGate uses key=value pairs, ASA emits coded messages, and pfSense’s filterlog produces CSV, so every pipeline needs per-format parsing before cross-vendor search works.
Centralization is also how you meet compliance. PCI DSS requires 12 months of retention with daily review, and firewall storage rarely holds a year of logs. A relay tier makes the pipeline hold up: it buffers through outages, filters before per-GB billing, and stays put when you swap a firewall or a SIEM. And watch allowed traffic as closely as denies — beaconing and exfiltration hide in permitted connections.
If you are setting this up now, a practical order of work:
-
Start with transport. Move every firewall you can to TCP or TLS forwarding this quarter.
-
Deploy the baseline intake pack first, then add per-vendor parsing packs as you onboard each firewall family.
-
Write your first relay filter to drop informational allows, and measure the SIEM ingest difference.
-
Alert on silence. A source that stops logging should page someone.
NXLog Platform runs this entire pipeline on-premises: NXLog Agent collects and parses at the edge, and the platform adds fleet management, storage, search, and dashboards on top, forwarding structured events to any SIEM. Try it free for up to 10 sources.
FAQ
- What is the best way to collect firewall logs?
-
Configure each firewall to forward syslog over TCP or TLS to a central collector that parses, filters, and buffers before forwarding onward. For firewall software on Windows hosts, a local agent reading the Event Log is more reliable than remote collection.
- Can one tool analyze logs from different firewall vendors?
-
Yes, provided it parses each vendor’s format into a common structure. PAN-OS sends comma-separated fields, FortiGate sends key=value pairs, and Cisco ASA sends coded text messages, so per-vendor parsing is what makes cross-vendor search and correlation possible.
- How long should you retain firewall logs?
-
PCI DSS v4.0.1 Requirement 10.5.1 requires at least 12 months of audit log history, with the most recent three months immediately available. The 2024 joint event-logging guidance from ASD’s ACSC and CISA sets no fixed period; it advises retaining logs long enough to support investigations and notes that some incidents take up to 18 months to discover. Sector rules and your own incident history may justify longer.
- Should firewalls send logs directly to a SIEM?
-
Direct forwarding works for small estates. At scale, a relay tier between firewalls and the SIEM adds disk buffering during outages, filtering before per-GB ingest billing, and a single place to normalize formats, which direct forwarding cannot provide.
- What is the difference between a firewall log analyzer and a SIEM?
-
A firewall log analyzer specializes in collecting, parsing, and reporting on firewall data. A SIEM correlates events from many source types and manages detections and cases. Most teams layer them: a collection and analysis tier feeds the SIEM structured, filtered firewall events.