
NXLog Agent plays a vital role in aggregating, processing, and forwarding logs to centralized platforms for analysis. Whether it’s system logs, application logs, or security audit trails, these agents are often the first line of visibility into what’s happening in your environment.
In many setups, especially large-scale infrastructures, NXLog Agent relays act as crucial intermediaries, collecting logs from edge systems and forwarding them to a SIEM or log analytics platform. Given their role, it is essential to ensure critical NXLog Agent instances are running reliably.
On the other hand, Zabbix is a highly flexible monitoring platform used to track the performance and availability of your IT infrastructure. By combining the two, you can detect issues early and maintain your logging infrastructure’s integrity. In this post, we’ll look at how to monitor NXLog Agent using Zabbix leveraging the NXLog Platform Agent Management API. We’ll walk through adding your NXLog Agent host to Zabbix, and creating items and triggers. We also provide the complete configuration as a Zabbix template to help you get started quickly.
Why Monitor NXLog Agent?
Given that NXLog Agent plays a critical role in your logging pipeline, it’s essential to have visibility into its status and performance. Monitoring your NXLog Agent instances ensures that:
-
The agent is running and healthy — Ensuring that NXLog Agent has not been stopped, intentionally or otherwise, is fundamental.
-
Log collection and forwarding are operating as expected — NXLog Agent not receiving or collecting new logs may result from unexpected infrastructure changes or an issue at the log source.
-
Errors or misconfigurations are detected promptly — Syntax errors in configuration files or incorrect parameters can silently break log collection.
-
Resource usage is within acceptable limits — Excessive resource usage may indicate a configuration not optimal for the actual load.
What is the NXLog Platform Agent Management API?
The NXLog Platform Agent Management API is a RESTful interface that allows you to:
-
Enroll and configure NXLog Agent instances.
-
Check the current status of agents.
-
View configuration and runtime statistics.
-
Retrieve agent logs and diagnostic information.
-
Perform administrative tasks such as renewing agent TLS/SSL certificates.
The Agent Management API is particularly useful for automated systems like Zabbix that can query endpoints, parse responses, and trigger alerts based on specific conditions. Monitoring NXLog Agent via the Agent Management API offers several key benefits:
-
Real-time insight — You get immediate access to runtime data, which can help diagnose issues proactively before they escalate.
-
Lightweight and agentless — Using Zabbix’s HTTP agent means no need for additional scripts or agents, just native functionality.
-
Scalability — Once set up, you can apply the same approach to monitor multiple systems, especially when paired with Zabbix templates.
Setting up Zabbix to monitor NXLog Agent
Now, let’s put words into action and set up Zabbix to monitor an NXLog Agent instance. We tested this setup with Zabbix 7.2.5 and NXLog Platform 1.5.
In this example, we’ll monitor the agent’s online status, whether it’s enrolled and configured, the CPU load, and memory usage. See Agent properties in the documentation for a complete list of properties you can retrieve. Skip to Sample Zabbix template if you’re familiar with Zabbix and want to save time on configuration.
Prerequisites
Before proceeding, ensure you have the following:
-
Administrative access to Zabbix. See Getting Zabbix if you don’t have it installed already.
-
NXLog Platform installed and configured.
-
An NXLog Agent instance connected to NXLog Platform.
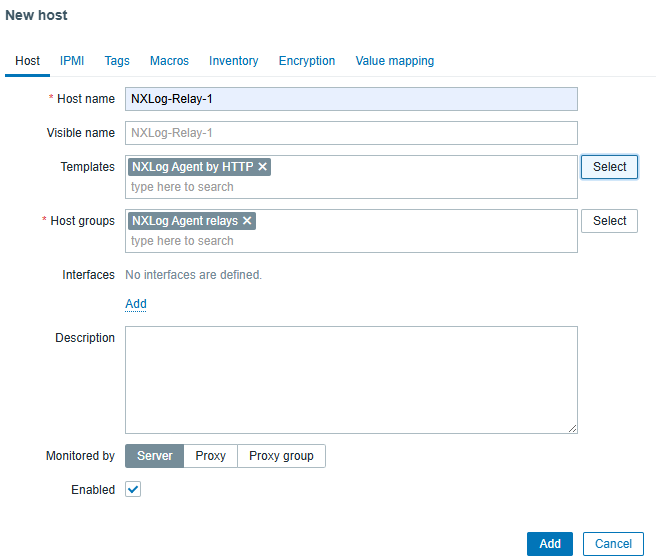
Add the NXLog Agent host
-
Open the Zabbix web interface and navigate to Data collection > Hosts.
-
Click the Create host button in the top right corner.
-
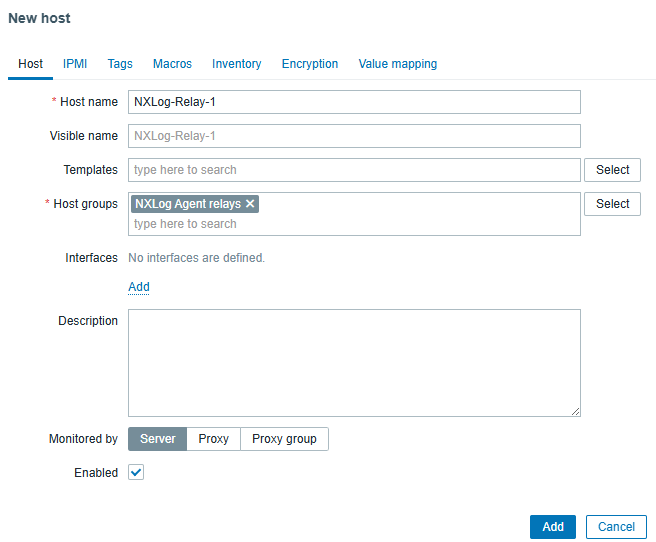
Enter the Host name, Host group, and any other optional information.
-
Click the Add button to finish adding the host.
Create an HTTP item
-
Navigate to Data collection > Hosts, find your host, and click Items.
-
Click the Create item button in the top right corner.
-
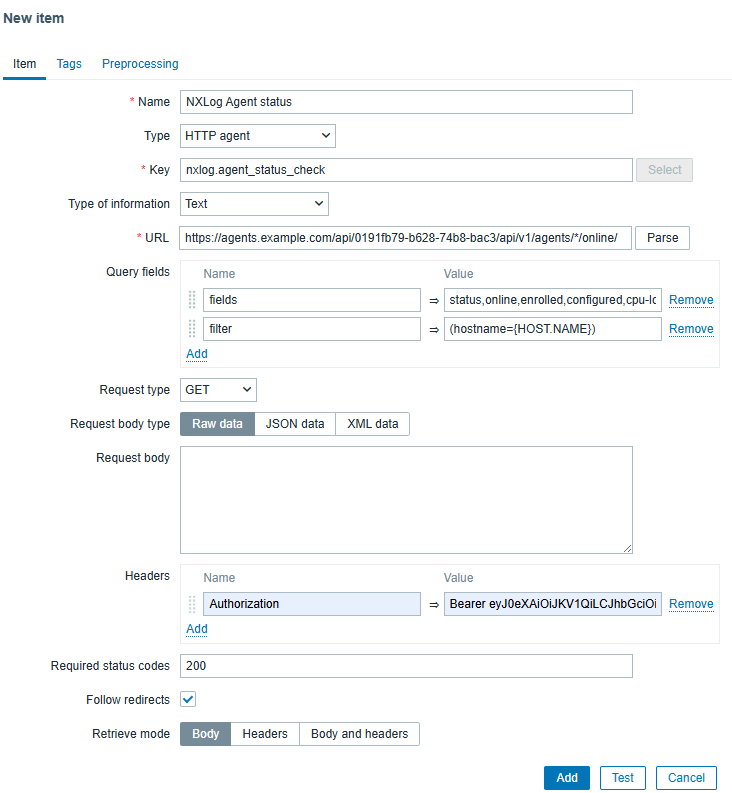
Enter a Name and Key for the new item.
-
Set the Type to HTTP Agent.
-
Set the Type of information to Text.
-
Enter your NXLog Platform Agent Management API URL. For example,
https://agents.example.com/api/<ORG_ID>/api/v1/agents/*/, whereexample.comis your NXLog Platform domain and<ORG_ID>is your NXLog Platform organization ID. -
Add the following Query fields:
-
fields —
online,enrolled,configured,cpu-load,memory-used -
filter —
(hostname={HOST.NAME})
-
-
Set the Request type to GET.
-
Add the following Header, replacing
<API_TOKEN>with your NXLog Platform API token.-
Authorization —
Bearer <API_TOKEN>
-
-
Your settings should look similar to the following screenshot:
-
Click the Add button to finish adding the item.
Create triggers
-
Navigate to Data collection > Hosts, find your host, and click Triggers.
-
Click the Create trigger button in the top right corner.
-
Enter a trigger Name. For example, NXLog Agent offline.
-
Choose the relevant Severity.
-
Click the Add button next to the Expression field.
-
Select the Item you just created.
-
Set the Function to jsonpath().
-
Enter the JSONPath. For example,
$.[0].online. -
Set the Result to
=andfalse.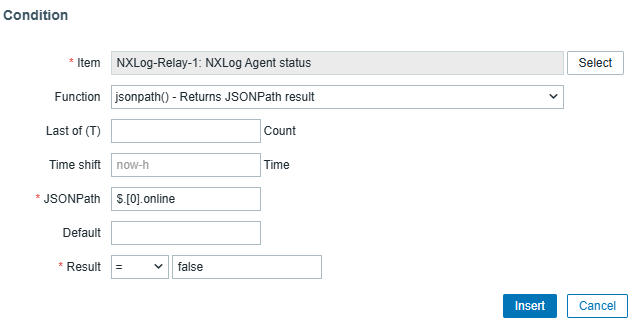
-
Click the Insert button.
-
Click the Add button to finish adding the trigger.
-
Repeat these steps for every property you want to monitor.
Test your configuration
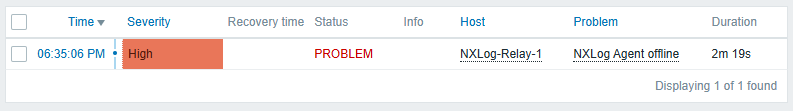
Once you’ve set up Zabbix to monitor NXLog Agent, you can test your configuration by temporarily stopping the NXLog Agent service and verifying that Zabbix detects the problem.
-
Navigate to Data collection > Hosts, find your host, and click Items.
-
Select your new item and click the Execute now button.
-
Navigate to Monitoring > Problems, and the page should list the NXLog Agent offline as a problem.
Sample Zabbix template
To make testing easier, we’ve prepared a Zabbix template with the configuration described above. To apply the template:
-
Download zbx_nxlog_agent_template.yaml.
-
Open Zabbix and navigate to Data collection > Templates.
-
Click the Import button in the top right corner.
-
Choose the zbx_nxlog_agent_template.yaml file and click Import.
-
Click Import again to finish importing the template.
Once you’ve imported the template, configure it with your settings:
-
Click on the template name NXLog Agent by HTTP.
-
Switch to the Macros tab.
-
Set the value of
{$NXLOG_API_TOKEN}to your NXLog Platform API token. -
Update the value of
{$NXLOG_PLATFORM}:-
Replace
example.comwith your NXLog Platform domain. -
Replace
ORG_IDwith your NXLog Platform organization ID.
-
-
Click the Update button to save the settings.
Finally, follow the steps to Add the NXLog Agent host and select the NXLog Agent by HTTP template under Templates/Applications.
Closing thoughts
Monitoring NXLog Agent with Zabbix through the Agent Management API is a powerful way to maintain visibility into your logging pipeline. This method provides richer data, enhancing your observability setup and ensuring logs are collected and forwarded without disruption.
In this blog post, we’ve only touched the surface of what you can do with the NXLog Platform Agent Management API. We invite you to check out the Agent Management API documentation for in-depth information and how-tos. Our blog post on Installing and enrolling NXLog Agent automatically with Ansible and the Agent Management API might also interest you.