Financial services | Telemetry collection | Windows
The audit blind spot: collecting logs from mainframes and core banking systems your SIEM doesn't speak
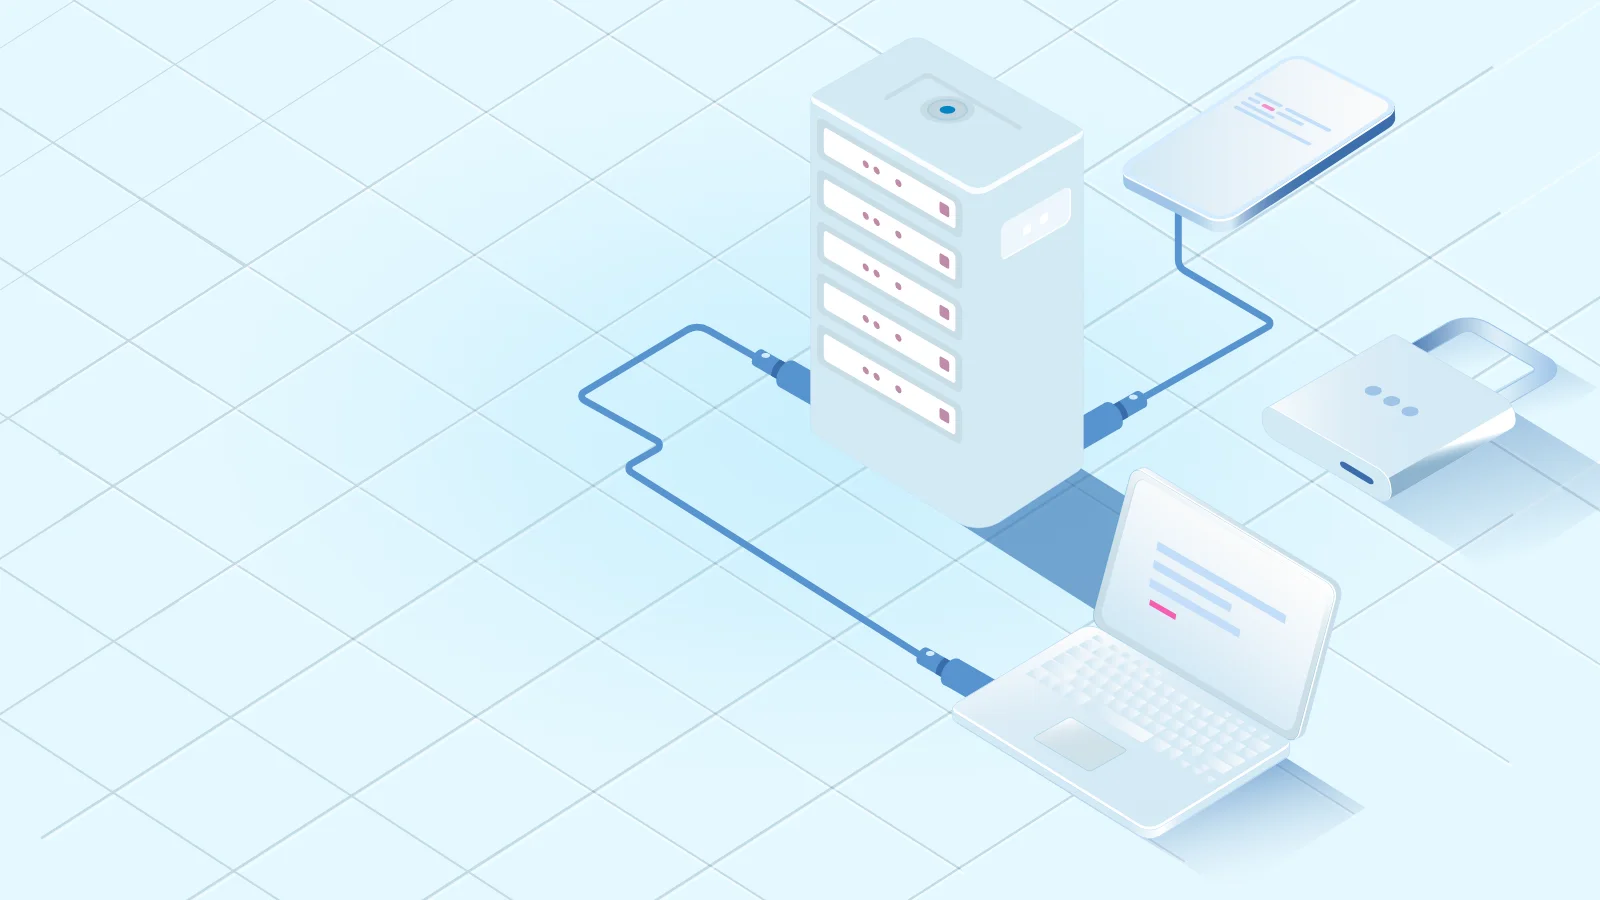
Every telemetry vendor’s demo runs on the same infrastructure: a clean, cloud-native, container-friendly stack where a modern agent drops in and just works. Then you go back to the bank you run day to day, where a mainframe still clears transactions, an IBM i (AS/400) system has been in production for decades, and a core-banking platform speaks a log format no off-the-shelf agent has heard of. That gap between the demo and the data center is where audit blind spots live.