
A Grafana Loki alternative for security log management | NXLog
Security telemetry needs more than app logs.
Grafana Loki aggregates application logs for observability, and it's good at that. NXLog Platform is built for security operations: Windows Event Log, ETW, DNS, and file integrity events, plus the aging systems that never left production — collected by one centrally managed agent and stored with retention you control, self-hosted or NXLog-hosted.
Fortune 500 companies trust NXLog





Grafana Loki vs. NXLog Platform at a glance
Walk through NXLog Platform at your own pace — agent enrollment, configuration, storage, and search included
Why security teams choose NXLog Platform

Built for security telemetry, not just app logs
Loki calls itself a log aggregation system inspired by Prometheus, built for application and Kubernetes observability — an accurate description of a good tool. NXLog Platform starts from a different question: can you collect, keep, and search the evidence a security investigation will need? Different question, different design.

A collection layer you rebuild once
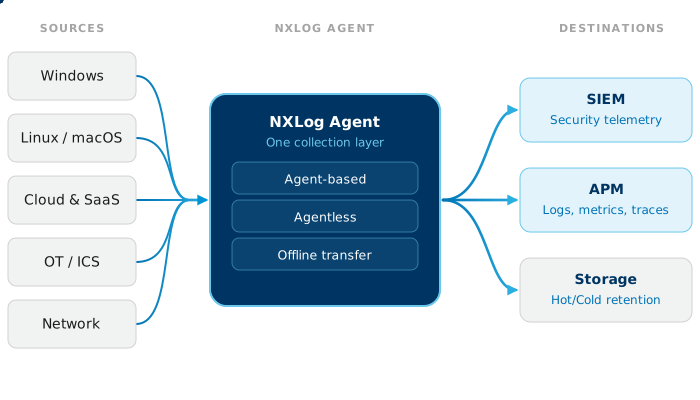
Two Grafana log shippers reached end of life four months apart: Grafana Agent in November 2025, Promtail in March 2026. Both migration paths end in a Grafana Alloy rewrite. NXLog Agent keeps one configuration language across every backend it ships to — so when you rebuild your collection layer, you only do it once.

Search the fields investigations pivot on
Loki's label guidance is blunt: keep user IDs, IP addresses, and request IDs out of labels, because every unique value spawns a new stream. Those are precisely the fields an investigator pivots on. NXLog Platform includes storage and search with no label schema to design — an IP address is just a field you search for.

Fleet management included, wherever you run
Enroll agents, push configuration, watch health, and roll out updates from the NXLog Platform console — included with every plan, running wherever the platform runs. In the Grafana stack, the Fleet Management console belongs to Grafana Cloud; self-managed Alloy fleets typically live in configuration files and GitOps pipelines.

One supported product, not a parts list
Grafana's own FAQ is upfront: when you self-host, availability, scaling, and maintenance of every component sit with your team — collector, storage, compactor, dashboards. NXLog Platform ships collection, agent management, storage, and search as one supported product, so your engineers spend their week on security work, not stack care.

Filter noise before it becomes cost
NXLog Agent drops, rewrites, and reformats events on the host, so only data worth keeping ships anywhere. The Port of Auckland credited NXLog's “filtration abilities that allowed us to ingest only valuable events” with direct savings on volume-priced ingestion (Lajos Varga, Head of Digital Technology). Filtered at the source, a log costs less everywhere downstream — on a Grafana Cloud meter or on your own disks.
Not sure where to start? We're happy to map out what collection, routing, and retention would look like on NXLog Platform
Value by Team

SOC engineers
When an alert fires, you pivot: this IP, that user, every host it touched, months back if needed. That search should be a query, not a label-schema design exercise. Collect from every endpoint and search on the fields that matter.

Compliance owners
Frameworks ask for years of searchable history, a defensible chain of custody, and data that stays in your jurisdiction. Keep logs on infrastructure you choose, with HMAC integrity checking on the pipeline and retention set by your policy.

IT operations
A thousand agents shouldn't mean a thousand config files. Enroll, configure, monitor, and update the whole fleet from one console — Windows, Linux, macOS, and the legacy servers that never made it into anyone's automation.

Teams keeping Grafana
Nobody says you have to leave. Keep Loki and Grafana for application observability, put NXLog Agent underneath for the telemetry your current collectors don't reach, and route each stream where it belongs — Loki, your SIEM, or NXLog Platform storage.
What you get with NXLog Platform
Deploy it your way
Run NXLog Platform in your data center, in your own cloud account, or let us host it for you. Loki self-hosts too — the difference is what you're running. NXLog Platform arrives as one packaged product with support behind it; a self-managed Loki stack is a set of components you compose, size, and keep healthy. Air-gapped networks work in both worlds. With NXLog Platform, so does opening a support ticket.
Source-based licensing, explained
A source is any distinct system, device, or application NXLog Agent collects from — a server, a firewall, a container cluster. Licensing counts sources and nothing else: no per-gigabyte fees, no events-per-second caps, no volume limits. The Free plan covers up to 10 sources with the full feature set, and volume discounts apply as the fleet grows.
Native Windows security collection
Windows Event Log through the modern API. Event Tracing for Windows for the channels Event Log can't see. Agentless collection from Windows Event Forwarding. Registry monitoring, file integrity monitoring, performance counters, and Microsoft DNS Server log parsing. Legacy modules still cover Windows XP, 2000, and 2003 for the estates where they linger.
Manage agents like a fleet
NXLog Platform enrolls new agents, distributes configuration from the center, watches agent health, and applies updates remotely. Solution packs ship working pipelines for common routes — Windows to Microsoft Sentinel, syslog to an OpenTelemetry backend, Okta to Google SecOps — so day one starts from a template, not a blank editor.
Process at the source
Filter, rewrite, and convert events on the host — between syslog, JSON, XML, CSV, CEF, LEEF, and GELF — before anything crosses the network. Disk buffering rides out outages, TLS and compression protect the wire, and repeated messages can be de-duplicated. A leaner stream costs less to move, store, and search, whatever sits downstream.
Keep Loki in the loop — if you want
You don't have to pick a side on day one. Loki 3.0 and later ingest OpenTelemetry logs natively, and NXLog Agent exports OTLP over HTTP(S) and gRPC — our blog also walks through shipping UFW logs to Loki with the HTTP output. Put NXLog Agent in front: collect the sources Alloy components don't reach, trim volume at the host, and keep feeding the Loki cluster you already run. Changing or adding a backend later is an output block, not a project.
Try NXLog Platform for free
FAQs
For collecting, managing, storing, and searching security logs — yes. For the rest of an observability stack — metrics, traces, Grafana dashboards — no, and this page doesn't claim otherwise. Loki 3.x also genuinely improved high-cardinality handling with structured metadata. If Loki serves your application observability well, keep it: NXLog Agent can collect for both sides of the house.
You can, and some teams do. It fits best when the estate is mostly Linux and Kubernetes, searches stay close to recent data, and someone owns the cluster full time. The friction appears on Windows-heavy estates, where the standard collection component reads the Event Log; on long-lookback pivots over IPs and user names, which label guidance keeps out of the index and the experimental bloom accelerator targets 75+ TB/month deployments; and in audit conversations about supported retention. Those jobs are what NXLog Platform is built around.
Three models, three shapes. Self-hosted Loki is free software: the cost is infrastructure plus the engineering time to run and scale it. Grafana Cloud prices logs per ingested gigabyte above a free allowance, with retention tiers — the bill tracks how loud your systems are. NXLog Platform is priced per source, flat, with a Free plan for up to 10 sources — the bill tracks how many systems you have, not how loud they get. Current figures for both are on the respective pricing pages: nxlog.co/platform/plans and grafana.com/pricing.
Yes. Loki 3.0 and later accept OpenTelemetry logs natively, and NXLog Agent's OpenTelemetry exporter delivers OTLP over HTTP(S) and gRPC. Our blog includes a worked example shipping UFW firewall logs to Loki through the HTTP output module as well. Plenty of teams run this split: NXLog Agent owns collection and source-side filtering; Loki remains the observability backend.
Any distinct system, device, or application NXLog Agent collects from counts as one source; virtual machines count individually. No plan carries per-gigabyte fees, events-per-second caps, or data volume limits — volume spikes during an incident change nothing on the invoice.
Promtail reached end of life on March 2, 2026 — no further updates, no further support. Grafana's documented path is converting your configuration to Grafana Alloy, and if Alloy covers your needs, that's a sound move. It's also the right moment to widen the comparison: NXLog Agent handles the same file and syslog collection, adds ETW, Windows Event Forwarding, registry and file integrity monitoring, and enrolls into a management console rather than another directory of config files. Whichever way you go, don't sit on an unsupported shipper.
Grafana, Grafana Loki, Grafana Alloy, and Promtail are trademarks of Grafana Labs. All other product names, logos, and brands are the property of their respective owners. Comparison statements reflect publicly available documentation as of August 2026
Follow us



© Copyright NXLog Ltd.