
A Chronosphere Telemetry Pipeline alternative
Self-hosted down to the control plane. Priced by source, not throughput.
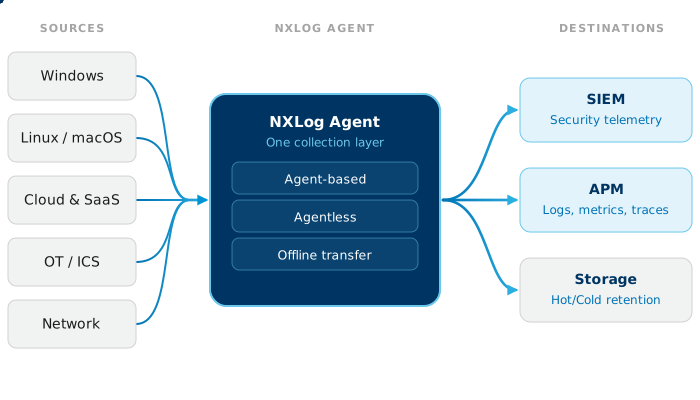
NXLog Agent collects security telemetry from Windows, Linux, macOS, and the legacy platforms other agents left behind. NXLog Platform manages the fleet, stores the data, and makes it searchable — on infrastructure you control, with nothing that has to reach a vendor cloud. One Linux host is enough. No Kubernetes cluster, no hosted control plane, no volume meter.
Fortune 500 companies trust NXLog





Chronosphere Telemetry Pipeline vs. NXLog Platform at a glance
Walk through NXLog Platform at your own pace — agent management, storage, and search, with nothing to install.
Why security teams choose NXLog Platform

Your control plane stays yours
Telemetry Pipeline splits the job: pipelines run on your infrastructure, but configuration and management live in a control plane Chronosphere operates. NXLog Platform keeps both halves inside your perimeter — in your data center, in your cloud account, or hosted by us if you prefer. The architecture doesn't decide for you.

No Kubernetes required
Every Telemetry Pipeline deployment is a Kubernetes workload — install it on a plain Linux server and it stands up a K3s cluster first. NXLog Platform installs on one Linux host with a bundled installer. Your SOC gets collection, storage, and search without adopting a container orchestrator to run it.

A bill that ignores traffic spikes
Chronosphere prices Telemetry Pipeline by throughput — the raw volume you push through it. NXLog licenses by source, flat. The endpoint that logs a hundred times its normal volume during an incident costs exactly what it did the day before.

Windows telemetry beyond the Event Log
NXLog Agent collects ETW traces, Windows Event Forwarding streams with no agent on the forwarding endpoints, Registry changes, file integrity events, and Microsoft DNS Server logs. Telemetry Pipeline's endpoint layer is Fluent Bit, whose Windows inputs read the Event Log.

Storage and search included
A pipeline moves data; it still needs somewhere to land. Telemetry Pipeline routes to a backend you run or rent separately. NXLog Platform ships with on-premises storage and search built in — you set the retention policy, and your auditors get their year of searchable history.

Trim the volume before it's metered
NXLog Agent drops, rewrites, and de-duplicates events on the endpoint, before anything crosses the network. Whatever sits downstream — a SIEM, an observability backend, or Telemetry Pipeline itself — receives less noise and meters fewer gigabytes.
Tell us what you collect and where it goes. We'll map the same estate onto NXLog Platform — sources, routing, retention, and what it costs.
Value by Team

SOC engineers
Mid-investigation is the wrong time to find a coverage gap. Collect ETW, WEF, DNS, and file integrity events from every endpoint — without a throughput gauge deciding what visibility you can afford.

Compliance owners
Data residency, multi-year retention, and integrity you can demonstrate. Logs stay on infrastructure inside your jurisdiction, with HMAC integrity checking on the pipeline.

IT operations
Running log collection shouldn't require a Kubernetes practice. One host, one console: enroll agents, push configuration, watch health, roll out updates — on Windows, Linux, macOS, and the legacy boxes.

MSSPs
Per-source pricing you can quote before onboarding, and margins that survive a noisy client. Volume discounts apply as you grow past 100 sources.
What you get with NXLog Platform
Deploy it your way
Run the whole platform — management, storage, search — in your data center or your cloud account, or have us host it. Nothing needs to reach an external control plane, so isolated and air-gapped networks are a supported deployment, not an exception request.
Source-based licensing, explained
A source is any system, device, or application NXLog collects from — a server, a firewall, a container cluster. Pricing counts sources and nothing else: no per-GB fees, no events-per-second caps, no data volume limits. The Free plan covers up to 10 sources with the full feature set.
Native Windows security collection
Windows Event Log through the modern API, ETW for the channels Event Log can't see, agentless collection over Windows Event Forwarding, Registry monitoring, file integrity monitoring, performance counters, and Microsoft DNS Server log parsing. Legacy modules still cover Windows XP, 2000, and 2003 where they survive.
Manage agents like a fleet
Enroll agents, distribute configuration from templates, watch health, and roll out updates from one console — across Windows, Linux, macOS, and the legacy systems in the back room. Solution packs ship working pipelines for common routes, such as Windows to Microsoft Sentinel or syslog to an OpenTelemetry backend.
Process at the true source
Filter events, rewrite fields, and convert between formats — syslog, JSON, XML, CSV, CEF, LEEF, GELF — on the endpoint, before data leaves the host. Buffer to disk through outages, compress and encrypt in transit, de-duplicate repeats. Processing downstream helps; processing at the origin is cheaper.
Keep Telemetry Pipeline in the loop — if you want
No rip-and-replace required. Telemetry Pipeline's documented source plugins include syslog, HTTP, and OpenTelemetry, and NXLog Agent delivers over all three. Put NXLog in front: reach the endpoints a Fluent Bit-based agent can't, cut the raw throughput its meter counts, and keep a clean exit path either way. Changing the destination later is a config edit on the agent, not a redeployment across the estate.
Try NXLog Platform for free
FAQs
For security log collection, management, storage, and search — yes, and you gain a management layer that runs where your data runs. Telemetry Pipeline covers ground NXLog doesn't aim at: high-volume routing of metrics and traces between backends, Kubernetes-native autoscaling and rollback, and processing rules you can script in Lua mid-pipeline. If pipeline-grade routing carries your observability stack, keep it — NXLog Agent can still be the endpoint layer underneath and forwards to any backend you choose.
Palo Alto Networks completed its acquisition of Chronosphere on January 29, 2026, and has stated that Telemetry Pipeline remains available as a standalone product. Where the roadmap goes from here is a question for your account team — we won't speculate. If part of your evaluation is keeping the collection layer independent of any single SIEM vendor, NXLog is independently owned and forwards to Microsoft Sentinel, Splunk, IBM QRadar, Google SecOps, Securonix, and ArcSight on equal terms.
Chronosphere prices Telemetry Pipeline on data throughput — the volume of raw data transmitted through the pipeline — with figures set in a sales conversation rather than published. NXLog Platform publishes its prices: Premium runs $12.12 per source per month at 11 sources, falling to $5.58 at 100, with volume discounts beyond that, and the Free plan covers up to 10 sources. The structural difference matters more than any single number: one bill tracks how much your systems say; the other tracks how many systems you have.
Yes. Telemetry Pipeline's documented source plugins include syslog, HTTP, and OpenTelemetry, and NXLog Agent delivers over all three — including OTLP over HTTP(S) and gRPC. Teams run this pattern to reach endpoints a Fluent Bit-based agent can't and to shrink raw throughput before it's metered: NXLog handles collection and source-side filtering, Telemetry Pipeline keeps doing the routing.
A source is any distinct system, device, or application NXLog collects from; virtual machines count individually. There are no per-GB fees, no events-per-second caps, and no data volume limits on any plan — the price of a source doesn't move with how much it logs.
Windows, Linux, and macOS, plus FreeBSD, IBM AIX, and Oracle Solaris — across x86, ARM, IBM Power, and SPARC hardware. Legacy input modules reach back to Windows XP, 2000, and 2003 where they still run.
Chronosphere and Chronosphere Telemetry Pipeline are trademarks of Chronosphere Inc., a wholly owned subsidiary of Palo Alto Networks, Inc. All other product names, logos, and brands are the property of their respective owners. NXLog is not affiliated with, endorsed by, or sponsored by Chronosphere Inc. or Palo Alto Networks, Inc. Comparison statements reflect publicly available documentation as of August 2026.
Follow us



© Copyright NXLog Ltd.